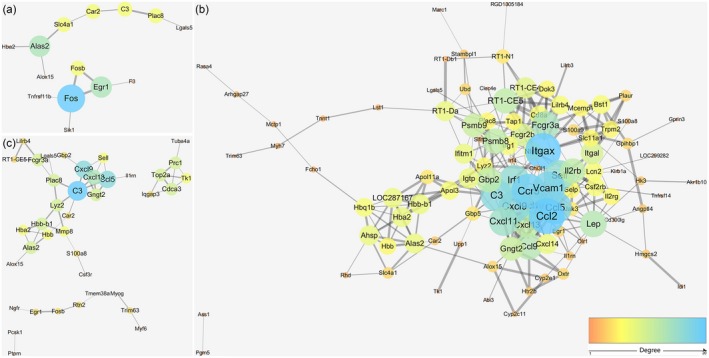
Figure 6.

Protein–protein interaction networks of genes differentially expressed at early (a), peak (b) and late (c) neuritis. Each node represents a protein. The node size and line width correlate with the degree and combined score of interaction, respectively. Disconnected nodes are not shown.
