
Figure 8.
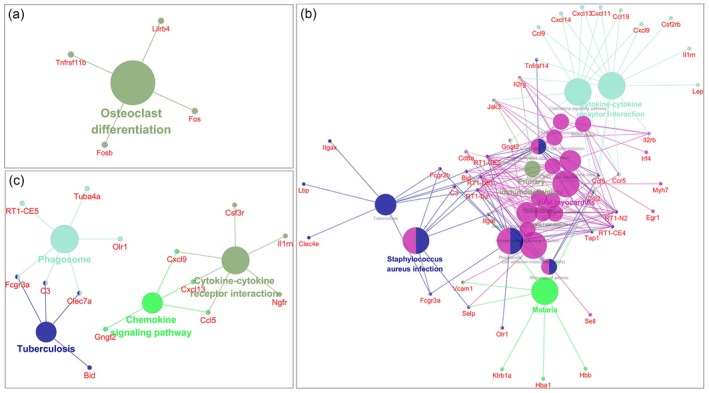
Kyoto Encyclopedia of Genes and Genomes (KEGG) pathways enriched among genes differentially expressed at early (a), peak (b) and late (c) stages of neuritis. Each node represents a pathway item. The node size relates to pathway significance: a smaller false discovery rate (FDR) value has a larger node size at different neuritis stages. Different node colors represent different functional groups. The most significant pathway of each group is highlighted. The edge between nodes reflects shared or common genes: a wider edge indicates a larger overlap.