
Figure 9.
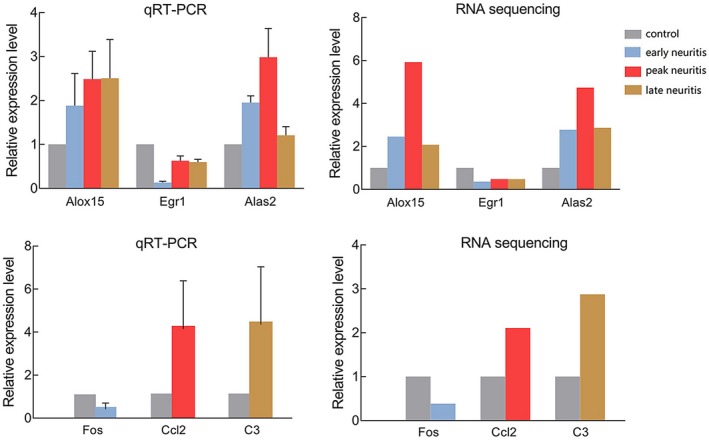
Quantitative reverse transcription–polymerase chain reaction (qRT–PCR) of select differentially expressed genes. The relative expression level of different mRNAs was obtained by the ΔΔCt method, and the relative mRNA expression value in controls was regarded as 1. Data are the mean ± standard error of the mean (s.e.m.), n = 3 per group.