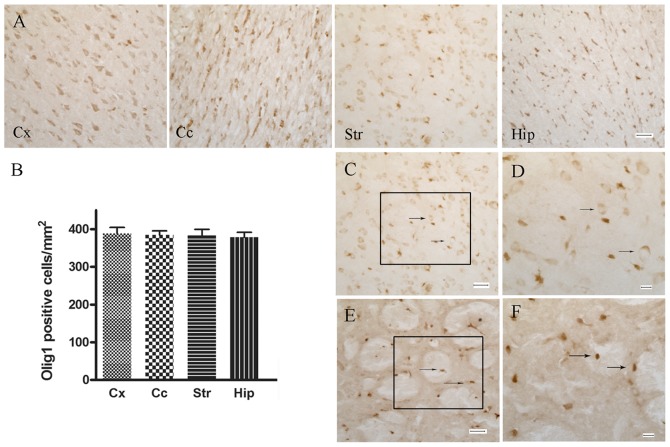
Figure 1.
Immunohistochemical staining of Olig1 in control and MCAO rats. (A) Distribution of Olig1 positive cells in different regions of the brain. Scale bar, 30 µm. (B) Statistical analysis of (A). (C) In normal rats, Olig1 was predominantly located in the cytoplasm and rarely in the nuclei of oligodendrocytes. Arrows indicate the cytoplasmic localization of Olig1. Scale bar, 30 µm. (D) Higher magnification of black box in (C). Scale bar, 10 µm. (E) MCAO rats exhibited extensive nuclear localization of Olig1. Arrows indicate the nuclear localization of Olig1. Scale bar, 30 µm. (F) Higher magnification of black box in (E). Scale bar, 10 µm. Olig1, oligodendrocyte transcription factor 1; MCAO, middle cerebral artery occlusion; Cx, cortex; Cc, corpus callosum; St, striatum; hip, hippocampus.

