Figure 4.
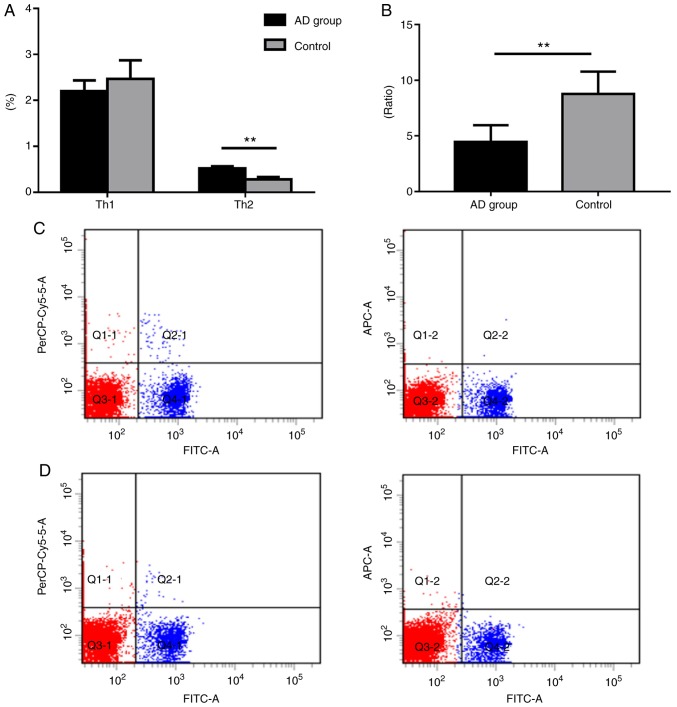
Expression profiles of Th1 and Th2 cells in murine spleens. (A) Th1 (CD4+IFN-γ+) and Th2 (CD4+IL-4+) cell percentage analysis. (B) Th1/Th2 ratio. Th1 and Th2 flow cytometry for the (C) control and (D) model groups. FITC, PerCP-Cy5.5, and APC denote CD4+, Th1 (CD4+IFN-γ+) and Th2 (CD4+IL-4+), respectively. Data are presented as the mean ± SEM (n=6). **P<0.01. Th, T-helper; IFN, interferon; IL, interleukin; FITC, fluorescein isothiocyanate; AD, atopic dermatitis.

