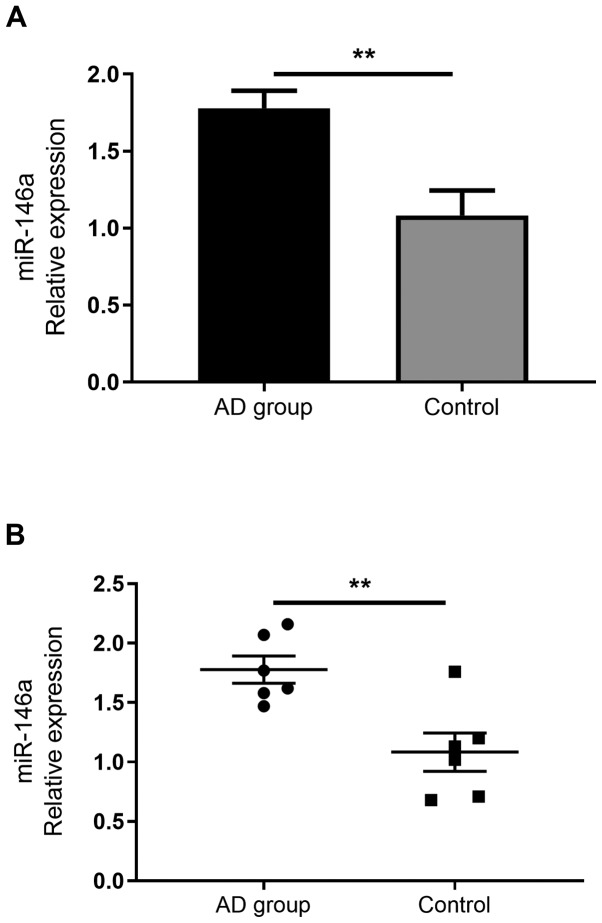
Figure 5.
Reverse transcription-quantitative PCR analysis of miR-146 expression in mouse skin. The experimental results revealed that the levels of miR-146a expression in the model group were significantly increased compared with the control group. (A) Histogram. (B) Scatter plot. Data are presented as the mean ± standard error of the mean (n=6). **P<0.01. miR, microRNA; AD, atopic dermatitis.

