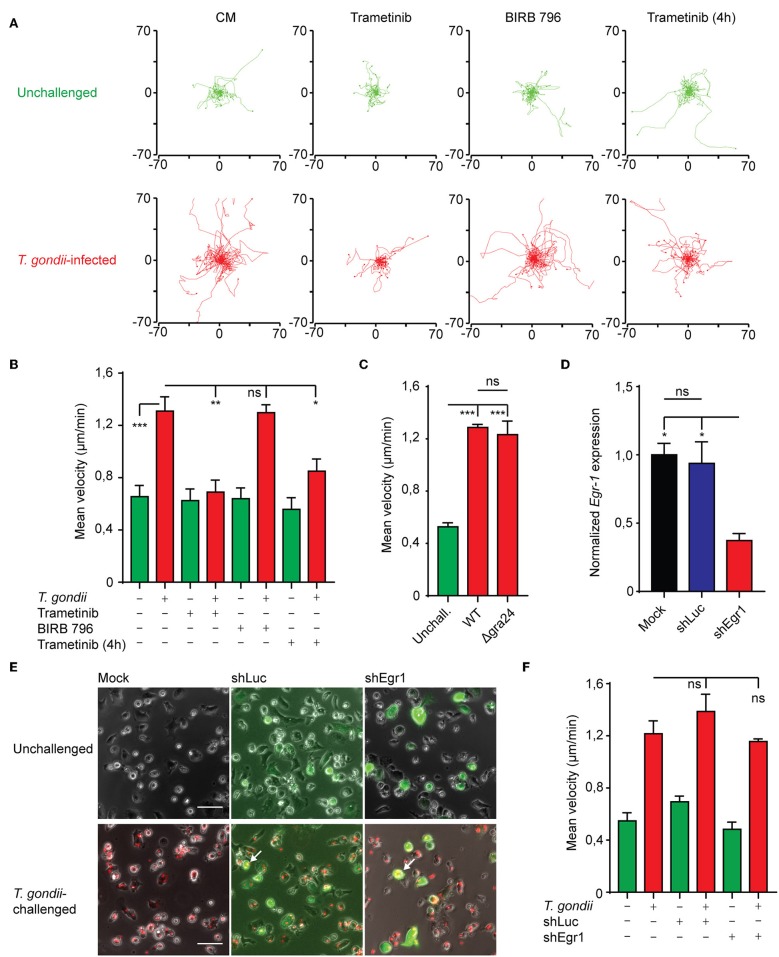
Figure 6.
Impact of MAPK inhibition on BMDC motility and motility analyses of Egr-1-silenced BMDCs. (A) Representative motility plots of BMDCs infected with freshly egressed T. gondii tachyzoites (PRU-RFP MOI 3) for 4 h in the presence of Trametinib or BIRB 796 for 4 h or with Trametinib added directly before a 1 h motility assay. (B) Quantification of the velocity of BMDCs from 4 independent experiments as in (A) (*p ≤ 0.05, **p ≤ 0.01, ***p ≤ 0.001, ANOVA, Tukey HSD). (C) Quantification of the velocity of BMDCs infected with freshly egressed Δgra24 or WT T. gondii tachyzoites (PRUku80) or unchallenged for 4 h in a 1 h motility assay (n = 3, ***p ≤ 0.001, ns > 0,05, ANOVA, Tukey HSD). (D) qPCR analysis of Egr-1 cDNA from mock transduced BMDCs or BMDCs transduced with shLuc-GFP or shEgr1-GFP lentivirus. Expression is normalized to mock and displayed as mean ± SE (n = 3, *p ≤ 0.05, ns p > 0.05, ANOVA, Tukey HSD). (E) Representative micrographs of mock transduced BMDCs or BMDCs transduced with shLuc-GFP or shEgr1-GFP lentivirus either left unchallenged or challenged with T. gondii tachyzoites (PRU-RFP MOI 3) for 4 h. White arrows indicate infected (RFP+) and transduced (GFP+) DCs. Scale bar 50 μm. (F) Quantification of the velocity of mock transduced BMDCs or BMDCs transduced with shLuc-GFP or shEgr1-GFP lentivirus either left unchallenged or challenged with T. gondii tachyzoites (PRU-RFP MOI 3) for 4 h in a 1 h motility assay (n = 3, ns p > 0.05, ANOVA, Tukey HSD).

