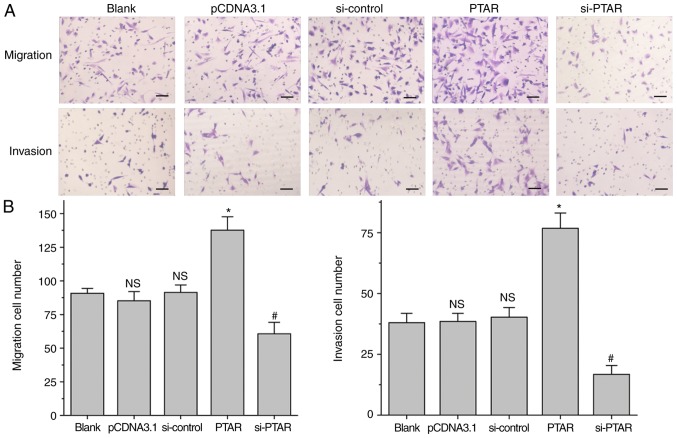
Figure 3.
Transwell assay to detect the effects of long non-coding RNA PTAR on A549 cell migration and invasion. (A and B) The number of migrated and invaded cells were counted following transfection with PTAR-overexpression plasmid or si-PTAR into A549 cells using Transwell chambers. *P<0.05 vs. pCDNA3.1 group. #P<0.05 vs. si-control group. Scale bar, 100 µm. N.S. indicates no significance compared with blank group. PTAR, pro-transition associated RNA; si, small interfering RNA; NC, negative control.

