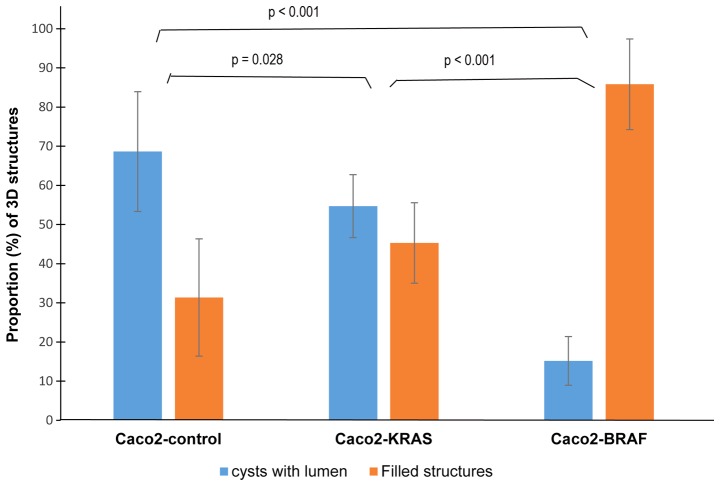
Figure 3.
Quantification of 3D structures. This is a graphical representation of 3D structures formed by control Caco-2 and Caco-2 cells with KRASor BRAF mutations at day 10. Columns represent average proportions (%) +/− standard deviation of 3D structures formed from each cell line, from three independent experiments. 3D, 3-dimensional.

