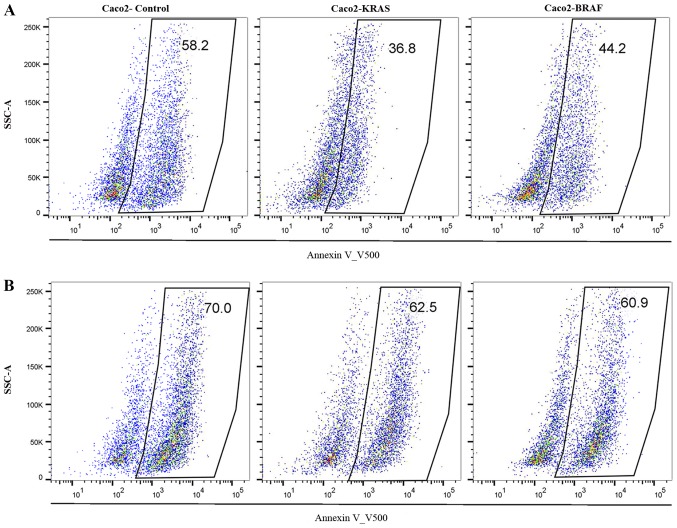
Figure 5.
Apoptosis assay from suspension cultures. The scatter plots showing proportions of annexin positive cells (apoptotic cell %) from Caco2-controls, Caco2-KRAS and Caco2-BRAF suspension cultures at (A) 24 h (upper row) and at (B) 48 h (lower row). Boxes represent annexin positive cells and the numbers indicate their proportions. SSC-A, side-scatter area plot.

