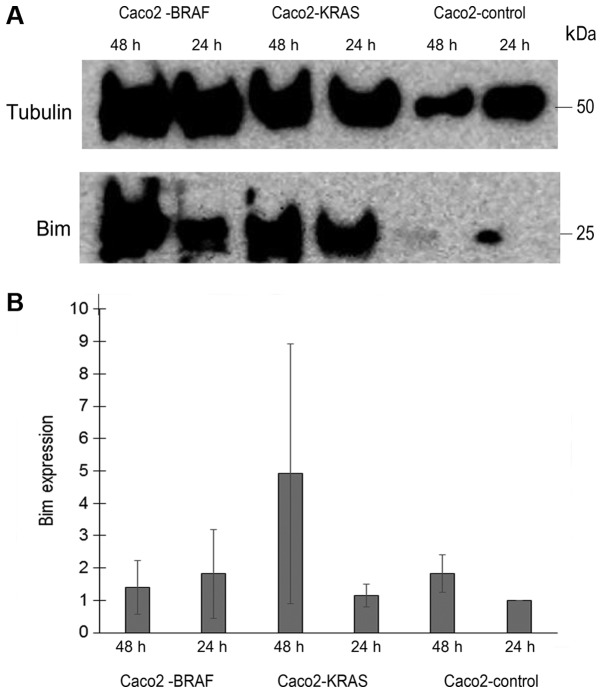
Figure 7.
Bim expression in native Caco-2 cells, and in Caco-2 cells transfected with KRAS V12 or BRAF V600. After 24 h or 48 h culture in suspension, Annexin negative cells were sorted lysed and analyzed for Bim expression level by western blotting. Tubulin was used for normalization. (A) Shows a representative western blot. (B) Shows mean values of normalized expression of Bim based on three experiments, relative to (fold change) expression in native Caco-2 cells at 24 h. Lines indicate standard error of the mean. There were no statistically significant differences between the cell lines.

