
Figure 1.
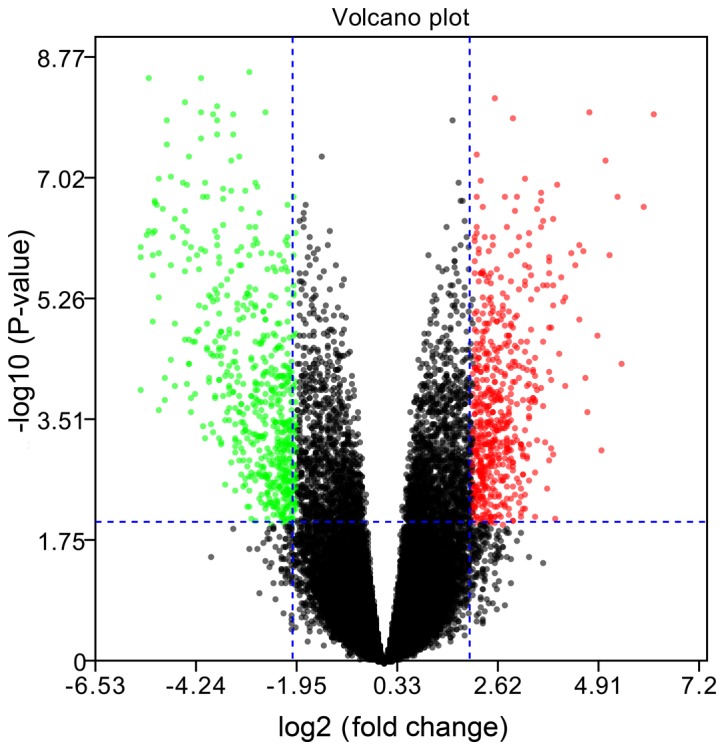
Volcano plot demonstrating an overview of the differential expression of all genes. The threshold in the volcano plot was -log10 adjusted P>2 and |log2 fold change| >2; red indicates upregulated genes, and green indicates downregulated genes.