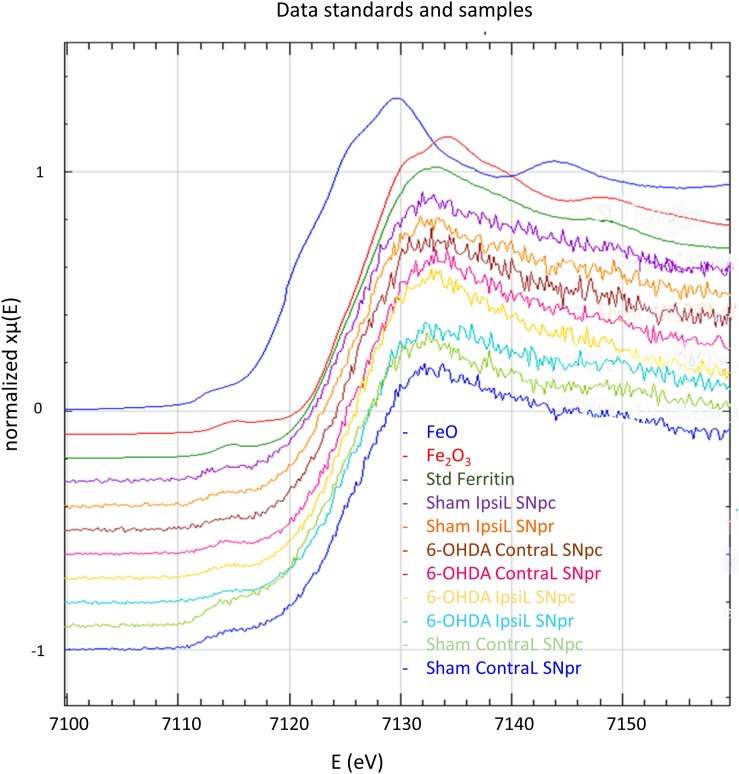
FIGURE 5.
X-ray absorption near edge spectroscopy spectra at Fe absorption K-edge for FeO, Fe2O3, ferritin standards and in the SNpc and SNpr for the ContraL and IpsiL brain sides of 6-OHDA injured and sham animals. All the measured spectra on brain samples show the same shape as ferritin and Fe(III) standards.

