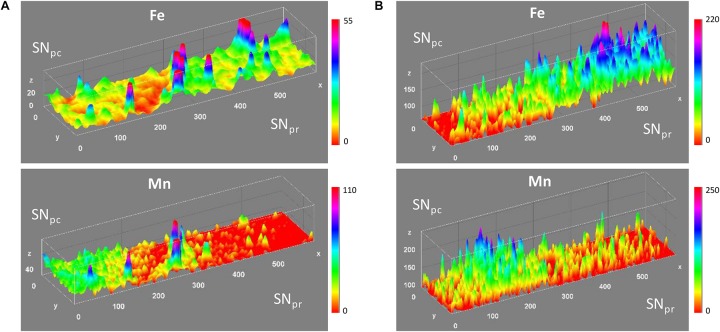
FIGURE 6.
Representative micro-SXRF distribution maps of Fe and Mn in the SNpc, appearing at the left side of the images, and SNpr, right side of the images. (A) Distribution maps of Fe and Mn along the SNpc and SNpr in the ContraL side of sham rat brain. (B) Distribution maps of Fe and Mn in the ContraL side of a 6-OHDA injured rat. Similar distributions were found in other cases with no effect of 6-OHDA. x and y axis in μm; z axis in number of x-ray fluorescence counts.

