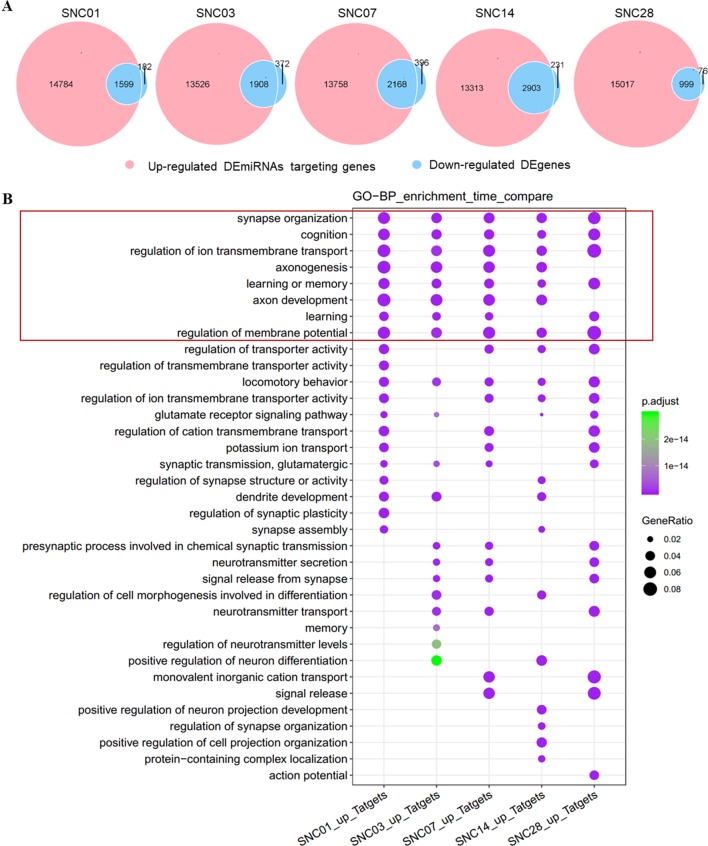
Figure 2.
Overlap of up-regulated DEmiRNAs vs. down-regulated DEgenes at different stages of ischemic stroke and their functional enrichment. (A) Venn diagram of up-regulated DEmiRNAs vs. the down-regulated DEgenes at different stages of ischemic stroke. Red represents up-regulated DEmiRNAs whereas blue represents the down-regulated DEgenes at the given time point. SNC, stroke vs. non-stroke (control) cortex; 01, 03, 07, 14, and 28, days 1, 3, 7, 14, and 28 after tMCAO surgery, respectively. (B) Gene sets at the intersection of each time point for the GO enrichment. An example comparison of the top 20 biological process (BP) pathways at each time point and the size of the point represents the proportion of the number of genes enriched in a given pathway in the background, whereas the background of the genes at each time point is the input of all the gene sets at that time point. The color of the dots represents the p value and the purple to green gradient shows the statistical significance from the strong to weak values.

