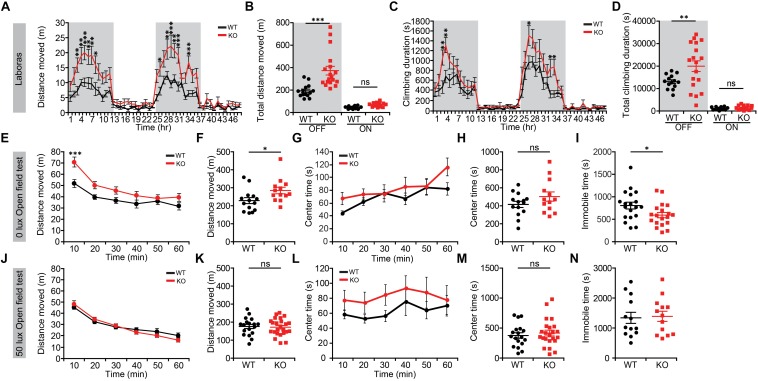
FIGURE 1.
Lrrc4c–/– mice display hyperactivity in a familiar environment. (A,B) Increased locomotor activity of Lrrc4c–/– mice (2–5 months; male) in Laboras cages (familiar environment), as shown by distance moved during the last two consecutive days. n = 14 mice (WT), n = 18 (KO), ∗p < 0.05, ∗∗p < 0.01, ∗∗∗p < 0.001, two-way repeated-measures ANOVA with Holm-Sidak multiple comparison test [(A) interaction, F(47,1410) = 3.206, p < 0.0001; time, F(47,1410) = 24.99, p < 0.0001; genotype, F(1,30) = 18.23, p = 0.0002; 3 h, p = 0.0072; 4 h, p = 0.0041; 5 h, p = 0.0007; 6 h, p = 0.0055; 7 h, p = 0.0016; 8 h, p = 0.0169; 26 h, p = 0.0483; 28 h, p = 0.0055; 29: p < 0.0001; 30 h, p = 0.0023; 31 h, p = 0.0003; 34 h, p = 0.0002; (B) interaction, F(1,60) = 11.36, p = 0.0013; genotype, F(1,60) = 19.99, p < 0.001; time, F(1,60) = 96.26, p < 0.001; OFF, p = 0.4393, ON, p < 0.001]. (C,D) Increased climbing of Lrrc4c–/– mice (2–5 months; male) in Laboras cages, as shown by climbing duration. n = 14 mice (WT), n = 18 (KO), ∗p < 0.05, ∗∗p < 0.01, two-way repeated-measures ANOVA with Holm-Sidak multiple comparison test [(C) interaction, F(47,1410) = 1.859, p = 0.0004; time, F(47,1410) = 27.58, p < 0.0001; genotype, F(1,30) = 6.135, p = 0.019; 3 h, p = 0.0056; 4 h, p = 0.0018; 27 h, p = 0.0163; 33 h, p = 0.0239; 34 h, p = 0.0157; (D) interaction, F(1,60) = 5.357, p = 0.0241; genotype, F(1,60) = 6.568, p = 0.0129; time, F(1,60) = 116.3, p < 0.001; OFF, p = 0.8612, ON, p = 0.0021]. (E–I) Modestly increased locomotor activity of Lrrc4c–/– mice (2–5 months; male) in the open-field test at 0 lux, as shown by distance moved. Note that the center time, a measure of anxiety-like behavior, is not altered and that immobile time is decreased in Lrrc4c–/– mice, in line with the hyperactivity in Lrrc4c–/– mice. n = 14 (WT), n = 13 (KO), ∗p < 0.05, ∗∗∗p < 0.001, ns, not significant, two-way repeated-measures ANOVA with Holm-Sidak multiple comparison test, Mann–Whitney test (F) and Student’s t-test (H) [(E) interaction, F(5,125) = 4.211, p = 0.0014; genotype, F(5,125) = 5.288, p = 0.0301; time, F(1,25) = 5.288, p < 0.001; 10 min, p = 0.0006; (F) U = 41; p = 0.0145; (G) F(5,200) = 2.606, p = 0.0262; genotype, F(1,40) = 0.0756, p = 0.7848; time, F(5,200) = 127.5, p < 0.001; (H) t(40) = 0.2749; p = 0.7848; (I) t(36) = 2.216; p = 0.0331]. (J–N) Normal locomotor activity of Lrrc4c–/– mice (2–5 months; male) in the open-field test at 50 lux, as shown by distance moved. Note that the center time and immobile time are not altered. n = 18 (WT), n = 24 (KO), ∗p < 0.05, ∗∗p < 0.01, ns, not significant, two-way repeated-measures ANOVA with Holm-Sidak multiple comparison test, Student’s t-test [(J) F(5,125) = 1.4, p = 0.2287; genotype, F(1,25) = 2.409, p = 0.1332; time, F(5,125) = 6.864, p < 0.001; (K) t(25) = 1.434; p = 0.1639; (L) F(5,200) = 0.315, p = 0.9036; genotype, F(1,40) = 1.127, p = 0.2948; time, F(5,200) = 1.348, p = 0.2457; (M) t(39) = 0.6046; p = 0.5489; (N) t(24) = 0.2570; p = 0.7994].

