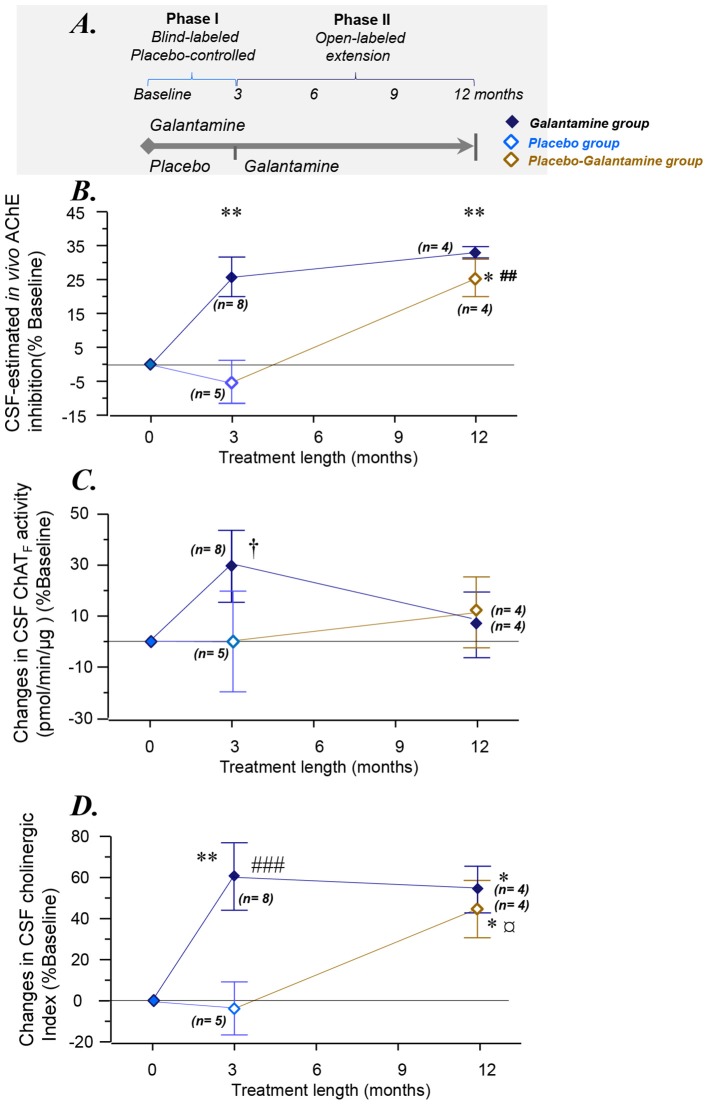
Figure 1.
Changes in the overall functional ChAT and AChE activities in CSF. (A) Schematic illustration of the galantamine study design (Kadir et al., 2008). (B) Changes in the total AChE activity in the CSF. (C) Changes in CSF ChATF activity. (D) Overall changes as a Cholinergic index in CSF after 3–12 months of the study. *p < 0.05, and **p < 0.01 signify differences compared to baseline. ##p < 0.01 and ###p < 0.001 signify differences compared to the Placebo group at 3 months. †p < 0.099 compared to baseline or the Placebo group. ¤p < 0.08 compared to the Placebo group (when n = 5, see also Supplementary Figures S1A,B). AChE = acetylcholinesterase. ChAT = choline acetyltransferase. CSF ChATF activity = the overall functional ChAT activity expressed in pmol/min/μg ChAT protein in the samples. CSF AChEF activity = the overall functional AChE activity expressed in nmol/min/μg AChE protein in the samples. CSF Cholinergic index = ratio of ChATF activity to AChEF in CSF.

