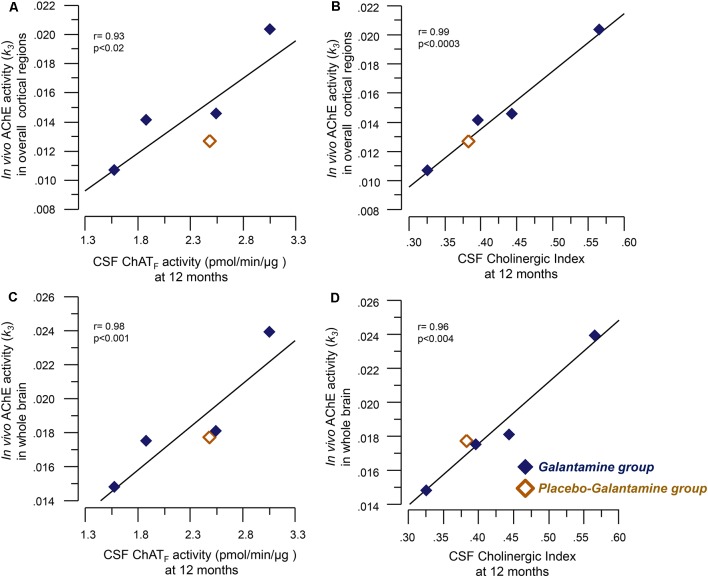
Figure 2.
Correlations between the in vivo brain AChE activity (k3) by PET and the CSF cholinergic markers. Panel (A) illustrates correlations between the in vivo AChE activity (k3) overall cortical regions and the CSF ChATF activity at 12 months. Panel (B) shows the corresponding correlation with the Cholinergic index in CSF. Graphs C and D show correlations between the in vivo AChE activity (k3) in the whole brain and CSF ChATF activity (C) and the Cholinergic index (D) in CSF at 9–12 months galantamine treatment. The k3 value has a direct relationship with AChE activity, i.e., a high k3 value means a high in vivo AChE activity. CSF ChATF activity = the overall functional ChAT activity expressed in pmol/min/μg ChAT protein in the samples. CSF AChEF activity = the overall functional AChE activity expressed in nmol/min/μg AChE protein in the samples. CSF Cholinergic index = ratio of ChATF activity to AChEF in CSF.

