Figure 5.
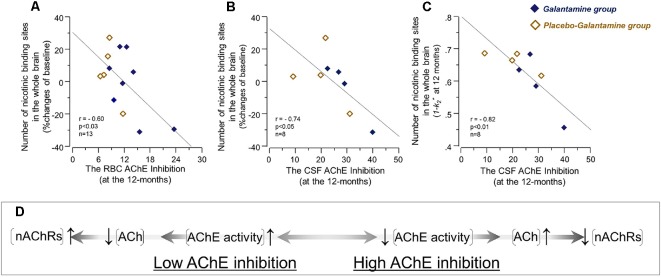
The initial co-dependency between the in vivo brain nicotinic binding sites and AChE activity was restored after 9–12 months treatment with galantamine. The graphs show negative correlations between the changes in the in vivo 11C-nicotine binding estimated by PET in the whole brain and the percent inhibition of RBC AChE activity (A), and the percent inhibition of total AChE activity in CSF (B) following 9–12 months galantamine treatment. In panel (C) is shown the negative correlation between the absolute nicotinic binding (1-k2*) values with the percent AChE inhibition in CSF. In panel (C) the 11C-nicotine binding values are given as 1−k2* since k2* values have an inverse relationship with this tracer’s binding, i.e., a low k2* values mean a higher 11C-nicotine binding level. The box (D) shows schematically a biodynamic model explaining the observed correlation between changes in the nicotinic binding and AChE activity at baseline (as shown in Figure 3) and here after 12 months of treatment (note that AChE inhibition shown here in graphs (A–C) have inverse relationship with AChE activity). In this model, high AChE inhibition (left-to-right on X-axis) means reduced AChE activity, which consequently means an increase in ACh level or a longer persistent of ACh in the synapses. This is balanced by adjustment of the nAChRs to lower levels (up-to-down on Y-axis). This might point at a protective feed-back mechanism against hyperexcitation state that may occur upon a too high AChE inhibition. Similarly, low AChE inhibition (right-to-left on X-axis) means higher AChE activity, which will reduce ACh levels and/or shorten its duration of action in the synapses. This is balanced by increases in the nAChR levels (down-to-up on Y-axis) to compensate for reduced level/duration of action of ACh. It should be noted that this model will not fit with the observations in the Galantamine group after 3 months treatment (as shown in Figure 4B), unless a general increase or remodeling of cholinergic-cholinoceptive interfaces is considered in the model, which would require simultaneous increases in both ChAT, AChE and nAChR levels, as was found in the current study. Open orange squares = the Placebo-Galantamine group. Dark squares = the Galantamine group. CSF, cerebrospinal fluid. PET, positron emission tomography; RBC, red blood cell; ACh, acetylcholine; AChE, acetylcholinesterase; nAChRs, nicotinic ACh receptors.

