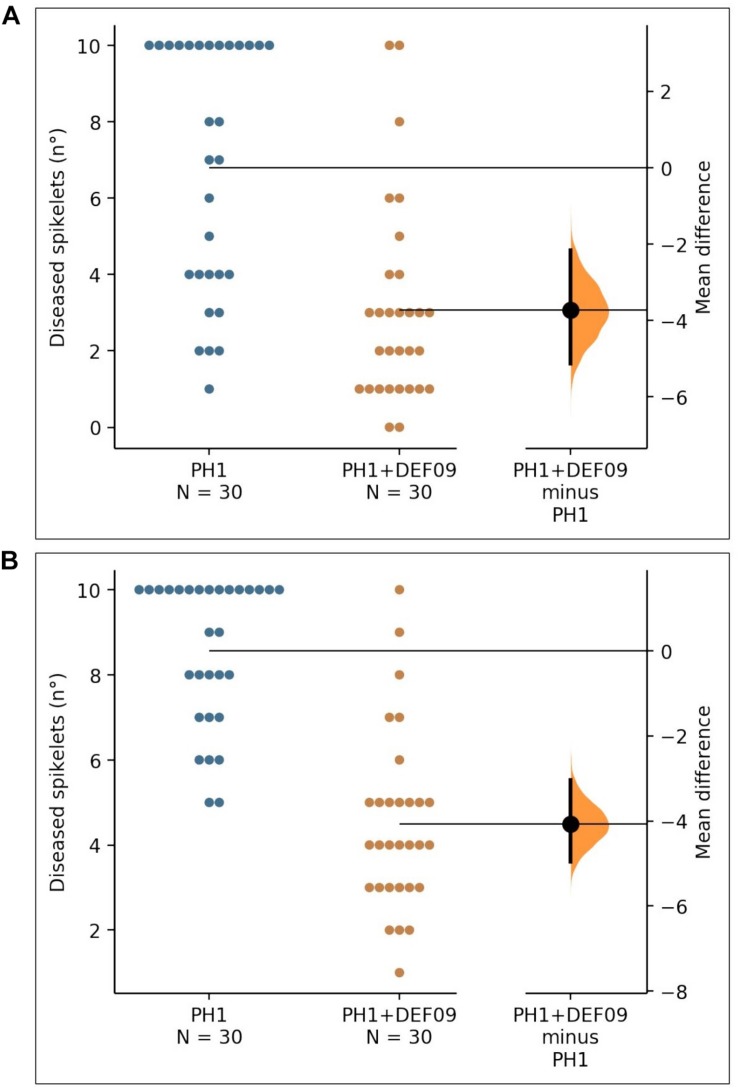
FIGURE 2.
The mean difference between PH1 and PH1 + DEF09 for diseased spikelets (n°) of cultivars “Bandera” (A) and “Claudio” (B) is shown in the Gardner-Altman estimation plot. The unpaired mean difference of data obtained between PH1 and PH1 + DEF09 is −3.73 (95.0% CI −5.13, −2.17) and −4.07 (95.0% CI −4.97, −3.03) for cv. Bandera and cv. Claudio, respectively. Both groups are plotted on the left axes; the mean difference is plotted on floating axes on the right as a bootstrap sampling distribution. The mean difference is depicted as a dot; the 95% confidence interval is indicated by the vertical error bar.

