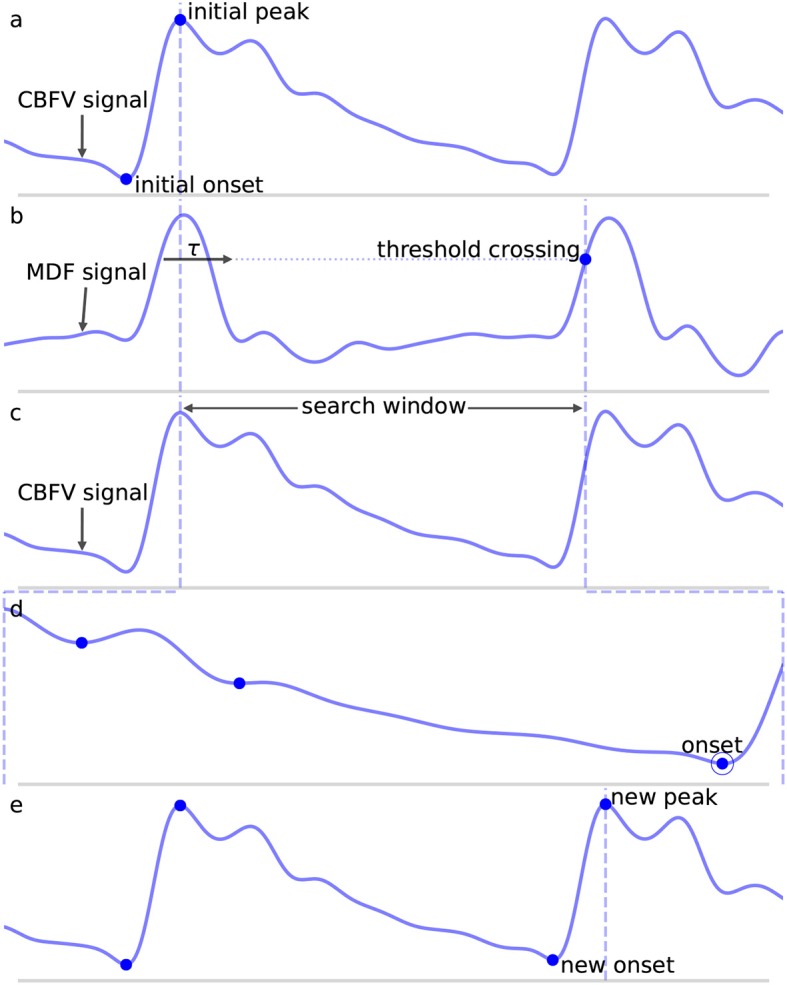
Figure 3.

Shown are the major steps in the algorithm, from an initial seed onset to detection of the next onset. The x (time) and y (CBFV/MDF amplitude) axes have been normalized to dimensionless quantities for ease of viewing. The algorithm proceeds from onset to onset in this manner until the end of the scan is reached. (a) Shows the initial onset in the CBFV signal, which consists of the onset point itself and its associated peak. (b) Displays the MDF signal associated with this same segment of data and shows how the search window is established after enforcing the refractory period and locating the threshold crossing point. (c) Shows the CBFV signal with the search window overlaid. (d) Shows a zoom-in of the search window and the location of all valleys, with the new onset labeled. Finally, (e) shows the original CBFV signal with the new onset identified.
