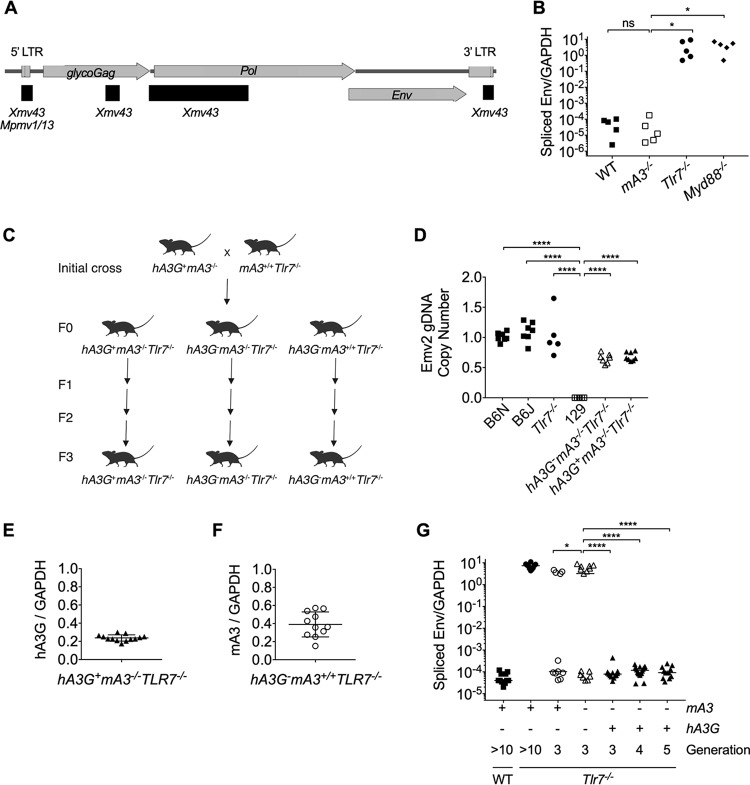
FIG 1.
Human APOBEC3G, but not murine APOBEC3, expression prevents the emergence of infectious ERV in Tlr7−/− mice. (A) Schematic of the structure and open reading frames of the Emv2-based ERV genome isolated from virions amplified through coculture with Tlr7−/− splenocytes. Recombined regions are denoted by black horizontal bars, and the ERV locus that contributed sequence is listed. (B) RT-qPCR of spliced Emv2 envelope expression from peripheral blood of C57BL/6N (n = 5), mA3−/− (n = 5), Tlr7−/− (n = 5), and Myd88−/− (n = 5) mice. (C) Breeding scheme used in this study. The initial cross used to generate the experimental lines is shown. Once the desired homozygous genotypes were obtained (F0), the separate lines were individually bred to the third generation (F3). (D) Quantification of Emv2 copy number by qPCR of gDNA isolated from ear punches of wild-type (WT) C57BL6/N (n = 7), WT C57BL/6J (n = 7), Tlr7−/− (n = 5), 129S1/SvImJ (n = 5), hA3G– mA3−/− Tlr7−/− (n = 7), and hA3G+ mA3−/− Tlr7−/− (n = 8). A primer set amplifying the envelope region of Emv2 was used. The fold copy number over the mean WT C57BL/6N value, normalized to the telomerase reverse transcriptase (Tert) copy number, is plotted. (E) RT-qPCR of hA3G expression from peripheral blood of hA3G+ mA3−/− Tlr7−/− (n = 13) mice. (F) RT-qPCR of mA3 expression from peripheral blood of hA3G– mA3+/+ Tlr7−/− (n = 11) mice. (G) RT-qPCR of spliced Emv2 envelope expression from peripheral blood of C57BL/6N (n = 13), Tlr7−/− (n = 11), F3 hA3G– mA3+/+ Tlr7−/− (n = 11), F3 hA3G-mA3−/− Tlr7–/– (n = 15), F3 hA3G+ mA3−/− Tlr7−/− (n = 13), F4 hA3G+ mA3−/− Tlr7−/− (n = 18), and F5 hA3G+ mA3−/− Tlr7−/− (n = 12) mice. Adjusted P values in Fig. 1B were calculated for one-way analysis of variance (ANOVA) with Dunnett’s multiple-comparison test comparing normalized spliced Emv2 expression values to those of the mA3−/− mice. Adjusted P values in Fig. 1D were calculated for one-way ANOVA with Dunnett’s multiple-comparison test comparing normalized Emv2 copy number values to those of the 129 controls, which lack the Emv2 locus. Adjusted P values in Fig. 1G were calculated for one-way ANOVA with Dunnett’s multiple-comparison test comparing spliced Emv2 expression values to those of the F3 hA3G– mA3−/− Tlr7−/− controls. ****, P < 0.0001; ***, P < 0.001; **, P < 0.01; *, P < 0.05; ns, not significant.

