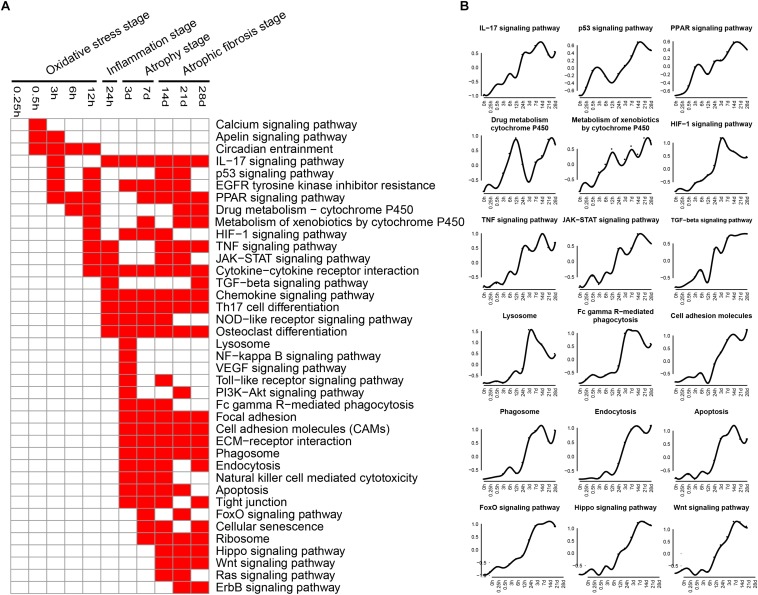
FIGURE 2.
KEGG pathway analysis of up-regulated expressed genes in TA muscles after sciatic nerve transection. (A) The enriched categories (red color) of pathways at different times post nerve injury. (B) The average expression profiles of DEGs involved in major pathways. The y-axis represents the averaged z-score of genes in the specific KEGG pathway.

