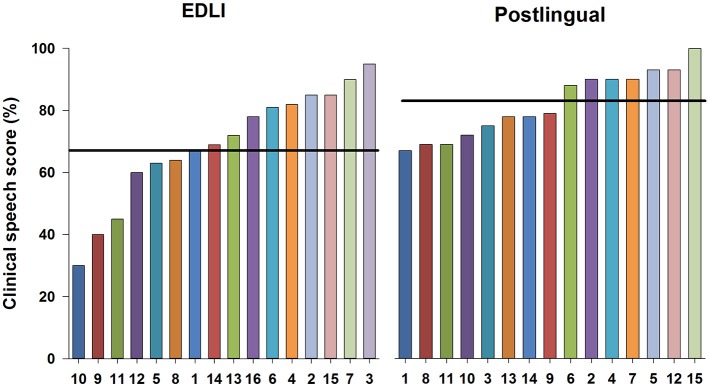
Figure 1.
The clinical speech scores shown per individual for the EDLI participant group on the left and for the postlingually deafened control group on the right. The scores are arranged from lowest to highest score in each panel, from left to right. The numbers on the x-axis represent the individuals as numbered in Tables 1, 2. The horizontal line represents the mean score per group.

