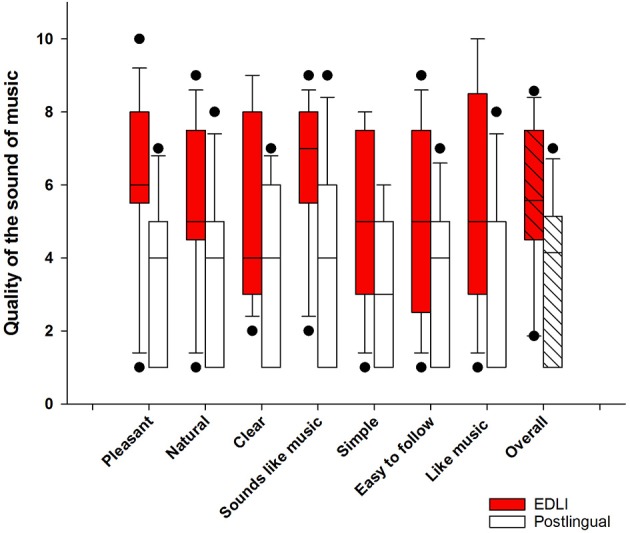
Figure 2.

The self-perceived quality of music for EDLI (in red) and postlingually deafened CI users (in white). The boxes represent the 25–75 percentile, the lines the median values, and the error bars the 10–90 percentile. The dots indicate the outliers.
