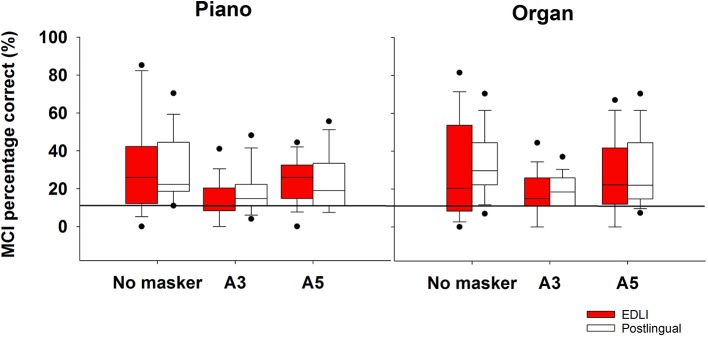
Figure 4.
The average percentage correct scores for the melodic contour identification for the piano (left) and organ (right) shown for both groups. From left to right in each panel the masker is shown: no masker, A3 overlapping pitch masker, A5 non-overlapping pitch masker. The box descriptions are similar to those of Figure 2. The thick horizontal line represents chance level.

