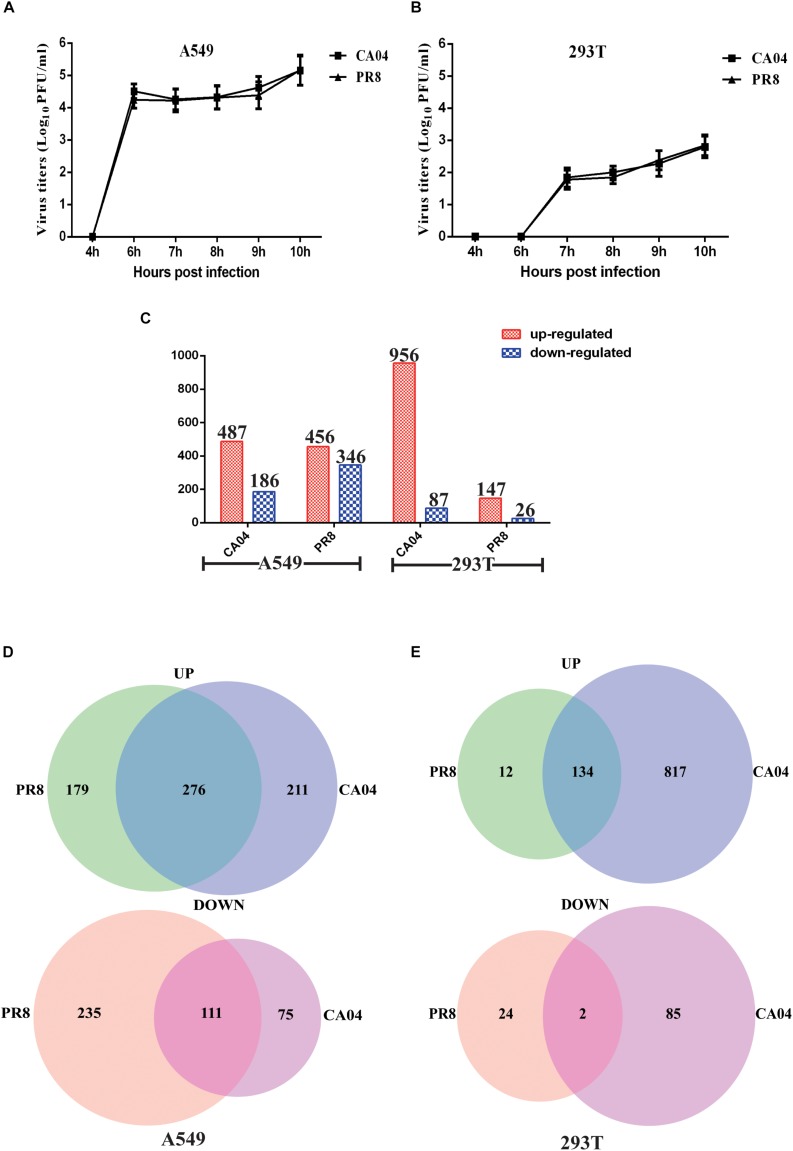
FIGURE 1.
Viral titers and overview of the RNA-seq data of the DEGs. Differential replication efficiency and transcript profiles of responses to H1N1 IAV infection of A549 and 293T cells. (A) Growth characteristics of IAVs in A549 (A) and 293T (B) cells. The cells were infected with PR8 or CA04 virus (MOI = 1), respectively. Culture supernatants were collected at the indicated time points and viral titers were determined by plaque assays. (C) Numbers of reliably quantified DEGs (fold difference ≥2 or ≤0.5) in the A549 and 293T cells following infection with two different H1N1 IAV strains, as compared to uninfected controls. (D) Venn diagram showing the distribution of shared DEGs among PR8- and CA04-infected A549 (D) and 293T cells (E).

