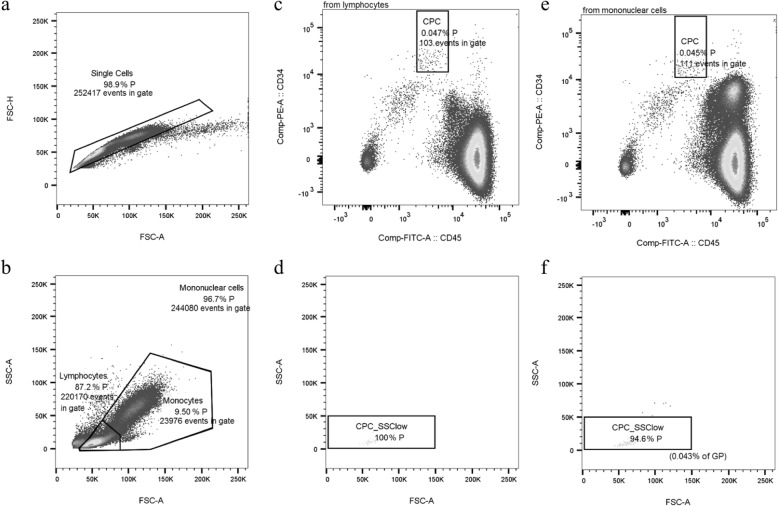
Fig. 2.
Flow cytometry analysis based on density gradient centrifugation. Gating characteristics (doublet exclusion, a; parent (P) populations, b) and fluorescent gating (CD34+/CD45dim cells within the lymphocyte gate, c; side scatter low, d; CD34+/CD45dim cells within the mononuclear cell gate, e; and side scatter low within the grandparent population (GP), f) after density gradient centrifugation. Absolute numbers represent the absolute amount of cells analyzed in the different gates, while percent numbers indicate cell amount relative to the (grand-) parent population (%P, %GP)

