
Fig. 5.
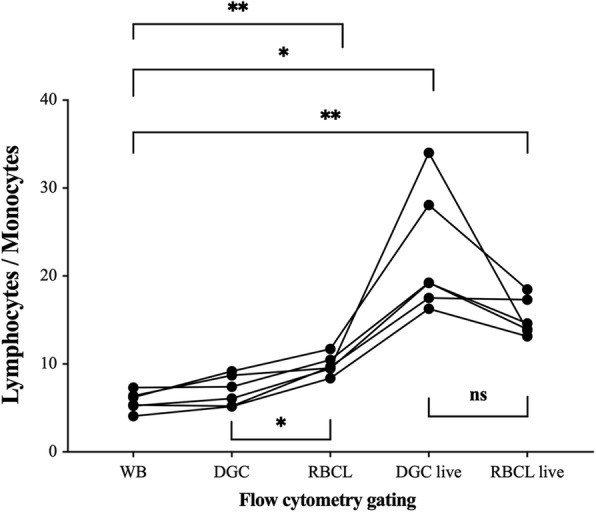
Cell change during flow cytometry analysis. Change of the lymphocyte-to-monocyte ratio as manually gated during flow cytometry analysis. Samples were taken from whole blood (WB), after density gradient centrifugation (DGC), after red blood cell lysis (RBCL), and after identification of live cells by fluorescent gating (DGC live, RBCL live). Individual values are displayed. n = 6. Repeated-measures ANOVA with Bonferroni post hoc comparisons was used for analysis. Significant differences are indicated as follows: *p < 0.05, **p < 0.01, ***p < 0.001