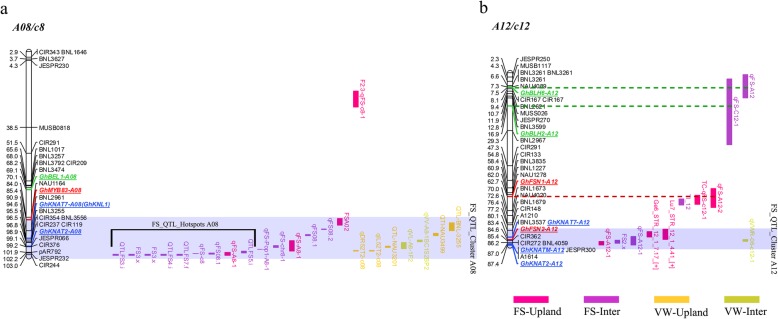
Fig. 4.
A genome-wide analysis of colocalization of all GhTALE genes in the sequenced genome TM-1 chromosomes (A08 and A12) with QTL hotspots for fiber strength (FS) and wall thickness (WT) traits in intraspecific upland cotton populations and interspecific G. hirsutum × G. barbadense populations. a QTL colocalization analysis of GhTALE genes on the A08 chromosome. b QTL colocalization analysis of GhTALE genes on the A12 chromosome. Gray shadowed segments indicate the QTL clusters on chromosomes. The range covered by black solid lines indicates the QTLs in the hotspot on chromosomes. The dotted line indicates the GhTALE genes in the QTL regions (but not at a hotspot or cluster) on chromosomes

