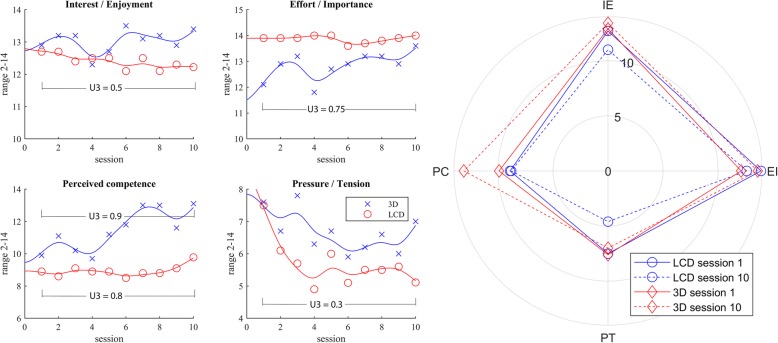
Fig. 5.
The changes in IMI measure scales in the LCD and the 3D group for each of the 10 sessions. Interpolation with smoothing spline polynomials is presented. The differences between the means of the 1st and 10th session are presented by the Cohen’s U3 index. The polar plot demonstrates that the changes of the IMI measure scales in the LCD group were negative and the in 3D group positive or remain equal

