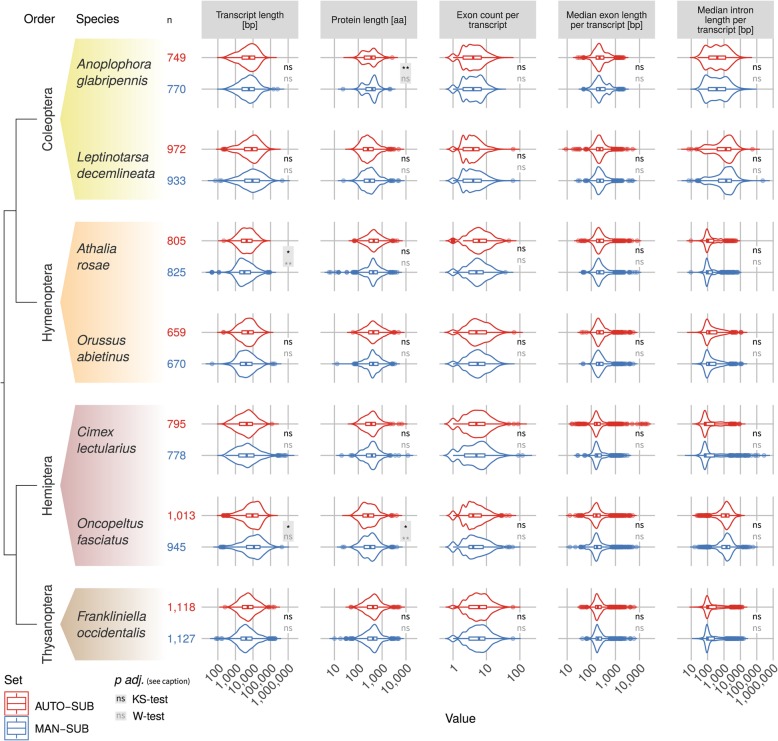
Fig. 1.
Comparison of property distributions: AUTO-SUB vs. MAN-SUB. Distributions (violin plots) of five gene structure properties per genome (semi-logarithmic) comparing AUTO-SUB (top, red) and MAN-SUB (bottom, blue): unspliced transcript length [bp], protein length [aa], exon count p.t., median exon length p.t. [bp], median intron length p.t. [bp] in facet columns. Additionally, box plots indicate the quartiles of the data distributions; lower and upper hinges correspond to the first and third quartiles. Samples sizes are given (n, AUTO-SUB: red, MAN-SUB: blue). Values are derived from the longest predicted transcript per gene. Adjusted p-values of Bonferroni-corrected two-sample Kolmogorov-Smirnov (KS) tests (black) and two-sample Wilcoxon (W) tests (gray) are indicated for each combination of AUTO-SUB vs. MAN-SUB (per species and property) and displayed with gray background if one of these is significant. ns: not significant. Facet rows contain seven species (Anoplophora glabripennis [Coleoptera], Athalia rosae [Hymenoptera], Cimex lectularius [Hemiptera], Frankliniella occidentalis [Thysanoptera], Leptinotarsa decemlineata [Coleoptera], Oncopeltus fasciatus [Hemiptera], Orussus abietinus [Hymenoptera]). Taxonomic orders are color-coded, color codes represent the insect orders Coleoptera (yellow), Hymenoptera (orange), Hemiptera (burgundy), and Thysanoptera (brown). The left side tree illustrates the order-level phylogenetic relationships (after [36])

