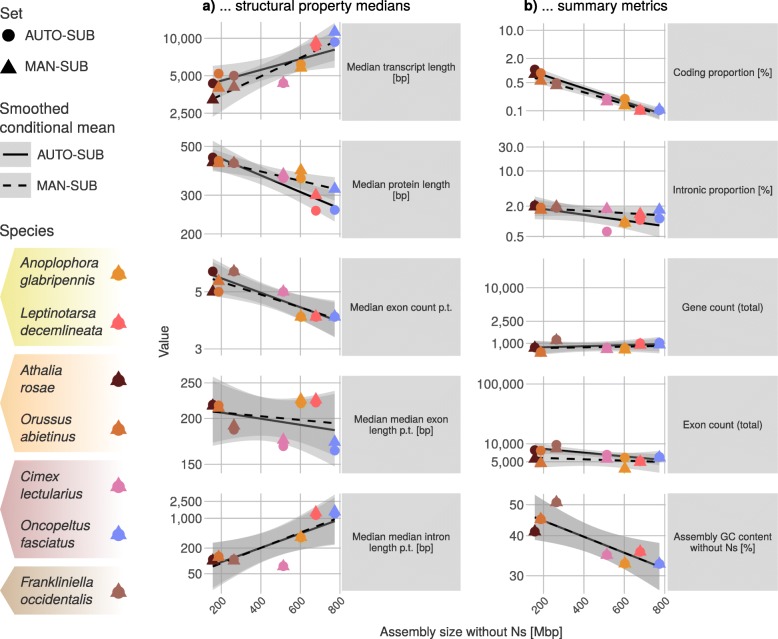
Fig. 2.
Comparison of AUTO-SUB and MAN-SUB subsets regarding correlations of... a) ... structural property medians (in rows from top to bottom): median unspliced transcript length [bp], median protein length [aa], median exon count p.t., median median exon length p.t. [bp], and median median intron length p.t. [bp] of AUTO-SUB (circles) and MAN-SUB (triangles) (semi-logarithmic). Notably, manual annotation of genes in two genomes with the largest assemblies (L. decemlineata, 1170 Mbp and O. fasciatus, 1099 Mbp) led to an increase (from AUTO-SUB to MAN-SUB, W-test) of the median transcript length (L. decemlineata: + 717.5 bp, p adj. = 1; O. fasciatus: + 1920 bp, p adj. = 0.07) and of the median protein length (L. decemlineata: + 45 aa, p adj. = 0.28; O. fasciatus: + 63 aa, p adj. = 0.003). In the three species with the smallest genome sizes in our sample (A. rosae, 163.8 Mbp; O. abietinus, 201.2 Mbp; F. occidentalis, 415.8 Mbp), manual annotation resulted in slight decreases of median transcript length (A. rosae: − 1132 bp, p adj. = 0.008; O. abietinus: − 1204 bp, p adj. = 1; F. occidentalis: − 937.5 bp, p adj. = 1) and median protein length (A. rosae: − 21 aa, p adj. = 1; O. abietinus: − 11 aa, p adj. = 1; F. occidentalis: − 0.5 aa, p adj. = 1). The two species with intermediate assembly sizes (A. glabripennis, 707.7 Mbp; C. lectularius, 650.5 Mbp), manual annotation resulted in a negligible decrease in median transcript length (A. glabripennis: − 393.5, p adj. = 1; C. lectularius: − 2 bp, p adj. = 1) and a slight increase in median protein length (A. glabripennis: + 31, p adj. = 1; C. lectularius: + 14.5 aa, p adj. = 1). b) … summary metrics (in rows from top to bottom): coding proportion [%] (i.e., the summed lengths of all exonic sequences in the annotation in relation to genome size), intronic proportion [%], total gene count, total exon count, and assembly GC content without ambiguity [%] of AUTO-SUB (circles) and MAN-SUB (triangles) (semi-logarithmic). Values are derived from the longest predicted transcript per gene. Line types indicate the smoothed conditional mean for AUTO-SUB (solid) and MAN-SUB (dashed). aa: amino acids; bp: base pairs; Mbp: mega base pairs; p.t.: per transcript; W-test: Bonferroni-corrected two-sample Wilcoxon test

