
Fig. 3.
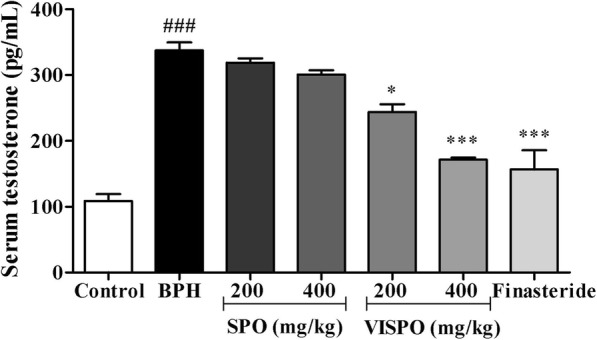
Effect of SPO and VISPO on serum testosterone level. The data were analyzed by one way ANOVA followed by Dunnet’s t-test. ###p < 0.001 vs. control group. *p < 0.05, ***p < 0.001 vs. the BPH group
Official websites use .gov
A
.gov website belongs to an official
government organization in the United States.
Secure .gov websites use HTTPS
A lock (
) or https:// means you've safely
connected to the .gov website. Share sensitive
information only on official, secure websites.
Effect of SPO and VISPO on serum testosterone level. The data were analyzed by one way ANOVA followed by Dunnet’s t-test. ###p < 0.001 vs. control group. *p < 0.05, ***p < 0.001 vs. the BPH group