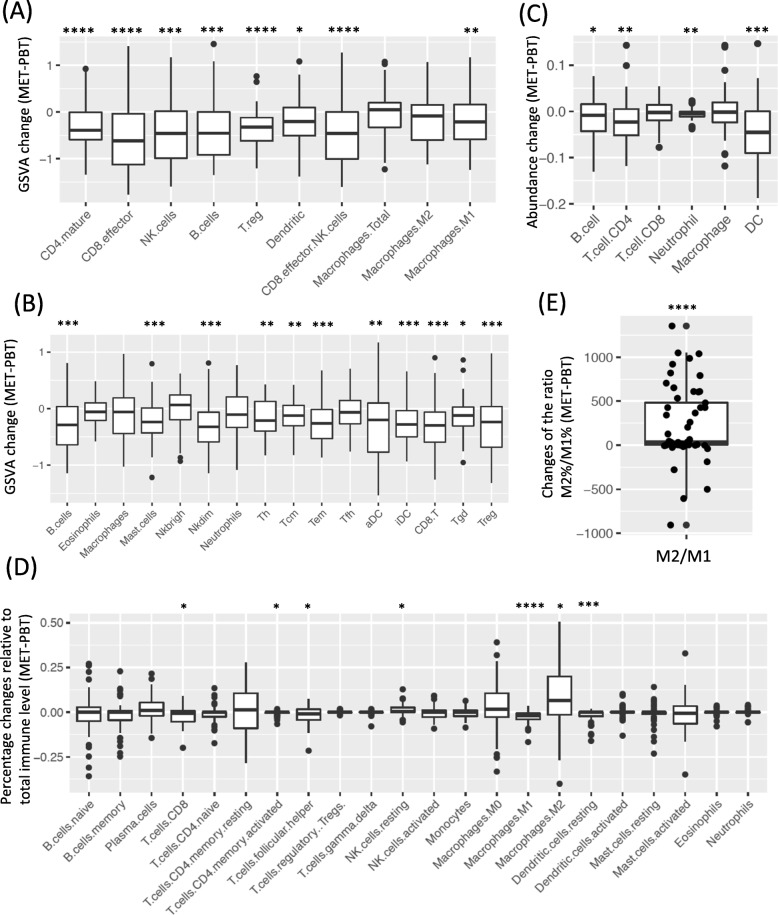
Fig. 2.
Paired comparison of the abundance of immune cell population in PBT/MET pairs in Pan-MET. a-b GSVA score changes (MET-PBT) of (a) Davoli signature and (b) Tamborero signature. c Abundance changes estimated by deconvolution method TIMER. d Changes of percentages relative to total immune level estimated by deconvolution method CIBERSORT. e Changes of the ratio of relative percentages of M2 and M1. ****FDR < 0.0001, ***FDR < 0.001, **FDR < 0.01, *FDR < 0.05 by Benjamini-Hochberg correction. Two-sided Wilcoxon signed rank test

