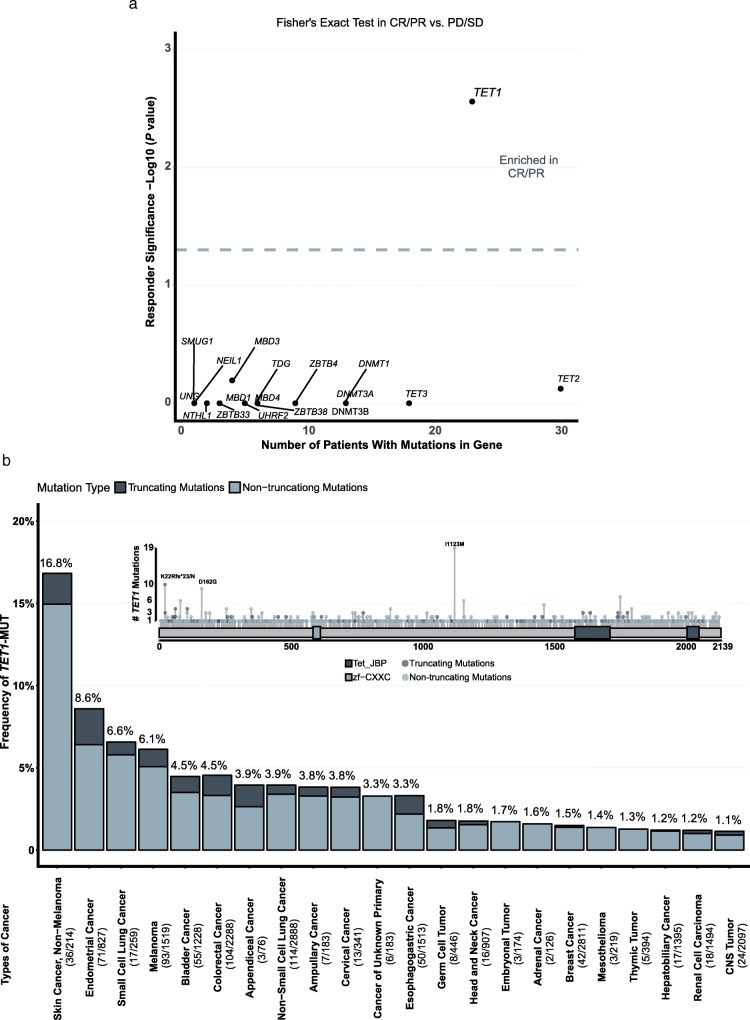
Fig. 2.
TET1-MUT was enriched in patients responding to ICI treatment. a. Response-associated mutations in CR/PR versus PD/SD (two-tailed Fisher’s exact test, n = 126 patients with CR/PR, n = 389 patients with PD/SD). The dashed grey line indicated false discovery rate adjusted P = 0.05 (Fisher’s exact test). b. The proportion of TET1-MUT tumors identified for each cancer type with alteration frequency above 1%. Numbers above the barplot indicated the alteration frequency, numbers close to cancer names indicated the number of TET1-MUT patients and the total number of patients. ‘CNS tumor’ denoted tumor in the central nervous system. ‘Truncating mutations’ included nonsense, nonstop, splice site mutations, and frameshift insertion and deletion; ‘non-truncating mutations’ included missense mutations and inframe insertion and deletion

