Fig. 3.
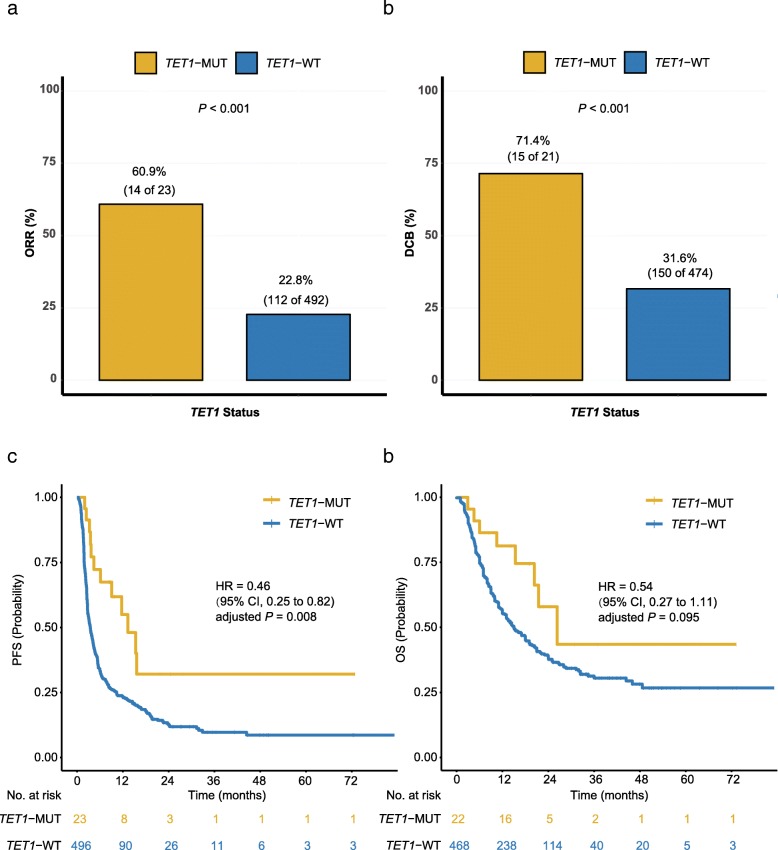
Association of TET1 status and clinical outcomes in the discovery cohort. a. Histogram depicting proportions of patients achieved objective response (ORR) in TET1-MUT and TET1-WT groups. (n = 515; 4 patients with best overall response not evaluable). b. Histogram depicting proportions of patients derived durable clinical benefit (DCB) in TET1-MUT and TET1-WT groups. (n = 495; 24 patients with durable clinical benefit not evaluable). c. Kaplan-Meier estimates of progression-free survival (PFS) in the discovery cohort comparing patients with TET1-MUT with their respective WT counterparts. (n = 519). d. Kaplan-Meier estimates of overall survival (OS) in the discovery cohort comparing patients with TET1-MUT with their respective WT counterparts. (n = 490; 29 patients with no OS information available)

