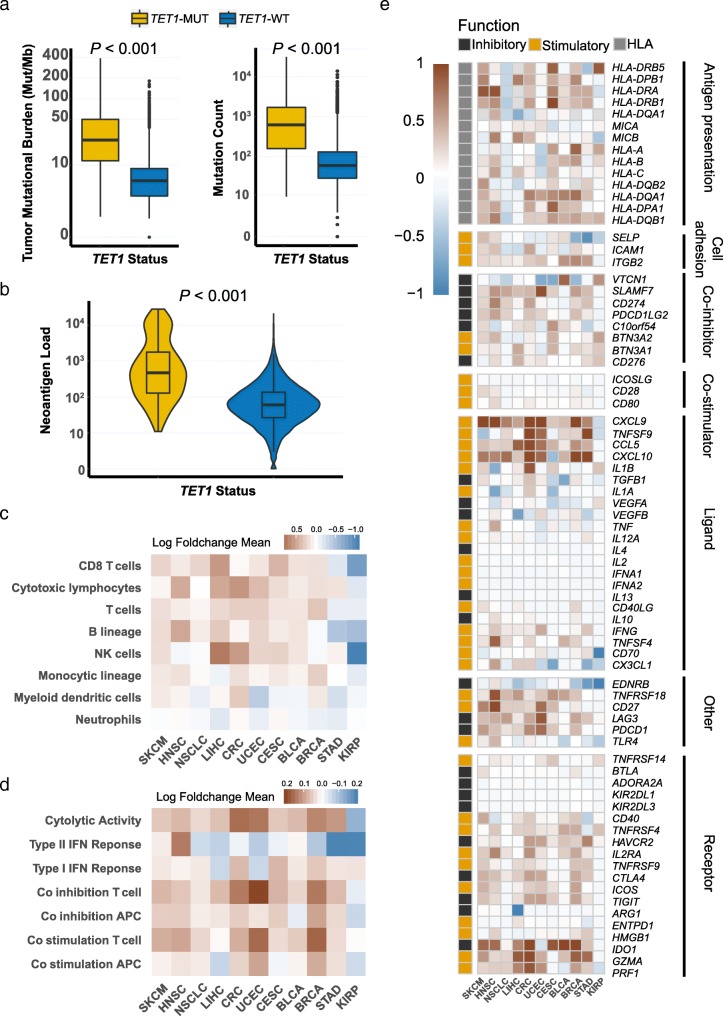
Fig. 6.
TET1-MUT was associated with enhanced tumor immunogenicity and activated anti-tumor immunity. a. Comparison of tumor mutational burden between the TET1-MUT and TET1-WT tumors in the Samstein’s cohort (left panel) and the TCGA cohort (right panel). b. Comparison of neoantigen load between the TET1-MUT and TET1-WT tumors in the TCGA cohort. c. Heatmap depicting the log2-transformed fold change in the mean tumor-infiltrating leukocytes MCP-counter scores of the TET1-MUT tumors compared to TET1-WT tumors across different cancer types. d. Heatmap depicting the log2-transformed fold change in the mean immune signature ssGSEA scores of the TET1-MUT tumors compared to TET1-WT tumors across different cancer types. e. Heatmap depicting the mean differences in immune-related gene mRNA expressions between TET1-MUT and TET1-WT tumors across different cancer types. The x-axis of the heatmap indicated different cancer types and the y-axis indicated tumor-infiltrating leukocytes, immune signatures, or gene names. Each square represented the fold change or difference of each indicated tumor-infiltrating leukocyte, immune signature, or immune-related gene between TET1-MUT and TET1-WT tumors in each cancer type. Red indicated up-regulation while blue indicated down-regulation

