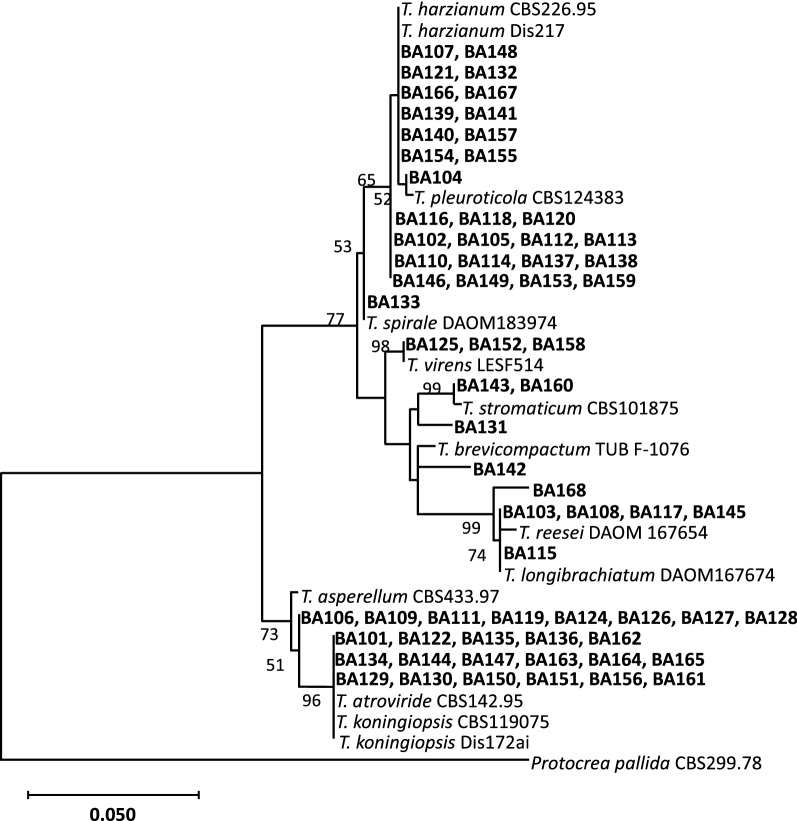
Fig. 1.
Phylogenetic tree of Trichoderma isolates from tropical sources based on sequences of the ITS region. The tree was constructed by using the Maximum Likelihood method with 425 aligned nucleotides from the ITS region of the rDNA. The nucleotide substitution model used was GTR + G to model evolutionary rate differences among sites [18]. The bootstrap analysis was performed with a 1000 resamplings and values above 50% are shown on the appropriate branches. The ITS sequence from Protocrea pallida was used as the outgroup. The list of (i) ITS sequences with accession numbers of the ‘BA’ isolates (Additional file 1: Table S1) and (ii) type species/ITS sequences with accession numbers used in the alignments (Additional file 2: Table S2) are shown in additional material. The scale bar represents the number of expected substitutions per site

