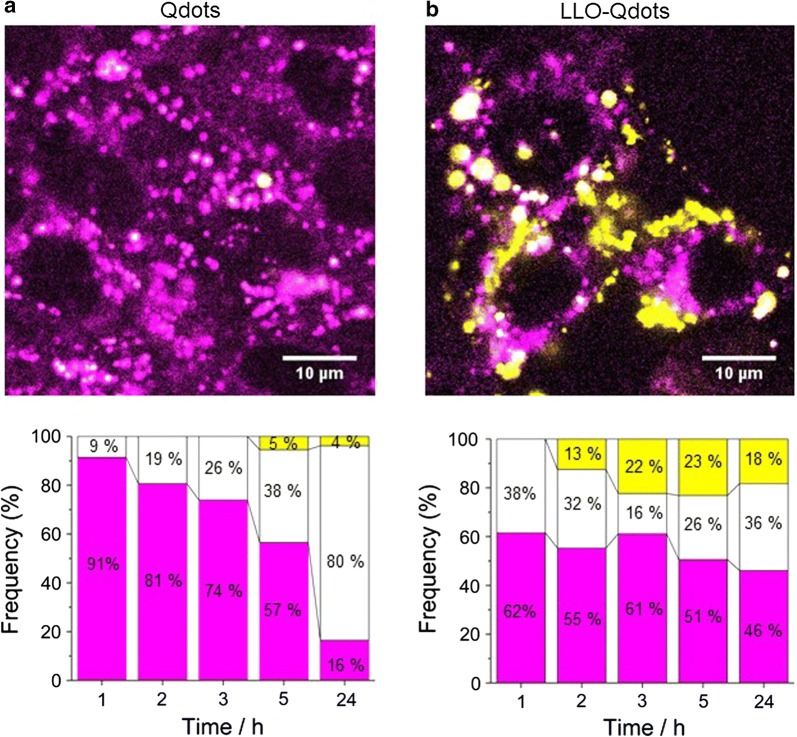
Fig. 3.
CLSM images of MEFs exposed to bare Qdots (a) and LLO-Qdots (b). Lysosomes visualized with LysoTracker® Green dye fluorescence at 511 nm (green) and QDot fluorescence at 655 nm (red). Images are presented in false color [48], where the LysoTracker® Green dye is shown in magenta and red Qdots are displayed in yellow when residing in the cytoplasm, or white inside the lysosomal system when colocalized with the magenta LysoTracker® Green dye

