Fig. 6.
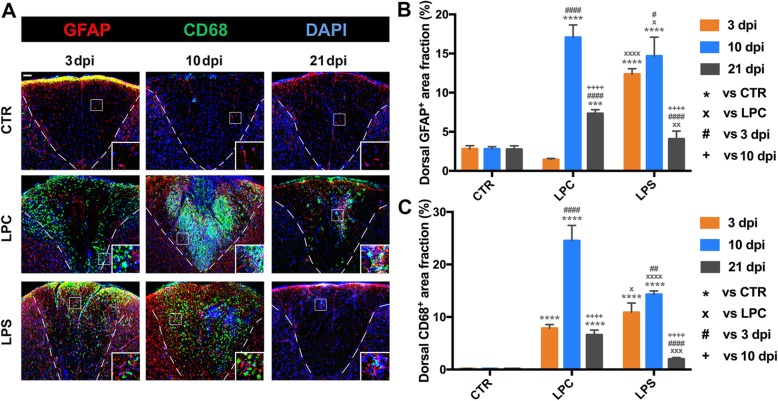
Dynamic glial activation after intraspinal injections of LPC and LPS. a Photomicrographs of immunostaining in the dorsal demyelination area showing the time course of astrocyte (GFAP+) and M/M (CD68+) activation at 3, 10, and 21 dpi. Dashed white line indicates the margins of the dorsal columns. Representative glial activation is better shown in the inset. Scale bar, 50 μm for panel figure; 25 μm for inset. b Quantification of astrocytic response within the dorsal columns (GFAP-labeling area fraction) at the lesion site in the three groups at 3, 10, and 21 dpi. GFAP-labeling area fraction was compared to the CTR group (***p < 0.001, ****p < 0.0001) and the LPC group (×p < 0.05, ××p < 0.01, ××××p < 0.0001) at each given time-point; for each group, GFAP+ area fraction was compared to 3 dpi (#p < 0.05, ####p < 0.0001) and 10 dpi (++++p < 0.0001). c Quantification of M/M response within the dorsal WM (CD68-labeling area fraction) at the lesion site in the three groups at 3, 10, and 21 dpi. The CD68-labeling area fraction was compared to the CTR group (****p < 0.0001) and the LPC group (×p < 0.05, ×××p < 0.001, ××××p < 0.0001) at each given time-point; for each group, CD68-labeling area fraction was compared to 3 dpi (##p < 0.01, ####p < 0.0001) and 10 dpi (++++p < 0.0001). Data were collected from three animals per group at each time-point (n = 3 mice)

