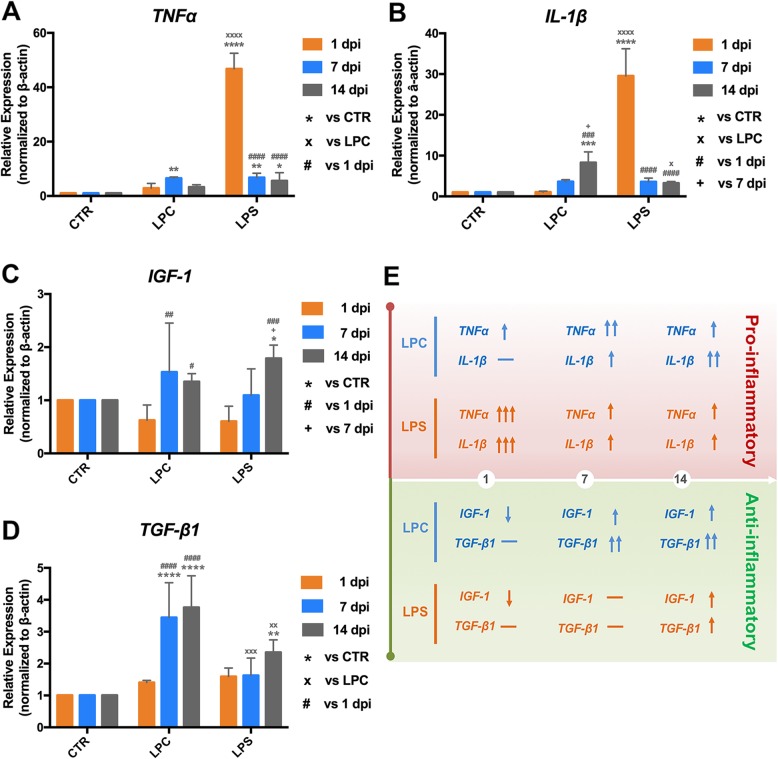
Fig. 7.
Time-course expression of pro-/anti-inflammatory cytokines at the injection level in LPC- and LPS-induced demyelination models. mRNA expressions of a TNFα, b IL-1β, c IGF-1, and d TGF-β1 within the epicenter of the spinal cord lesion were examined by real-time qRT-PCR at 1, 7, and 14 dpi. For each time-point, relative gene expression was compared to the CTR group (*p < 0.05, **p < 0.01, ***p < 0.001, ****p < 0.0001) and the LPC group (×p < 0.05, ××p < 0.01, ×××p < 0.001, ××××p < 0.0001); for each group, relative gene expression was compared to 1 dpi (#p < 0.05, ##p < 0.01, ###p < 0.001, ####p < 0.0001) and 7 dpi (+p < 0.05). e Graphic summary of the temporal expression of pro-inflammatory and anti-inflammatory cytokines in LPC and LPS models. The direction of arrow indicates an up- or down trend of each cytokine, and the number of arrows indicate the relative magnitude of the expression change. Data were collected from four animals per group at each time-point (n = 4 mice)

