
FIGURE 1.
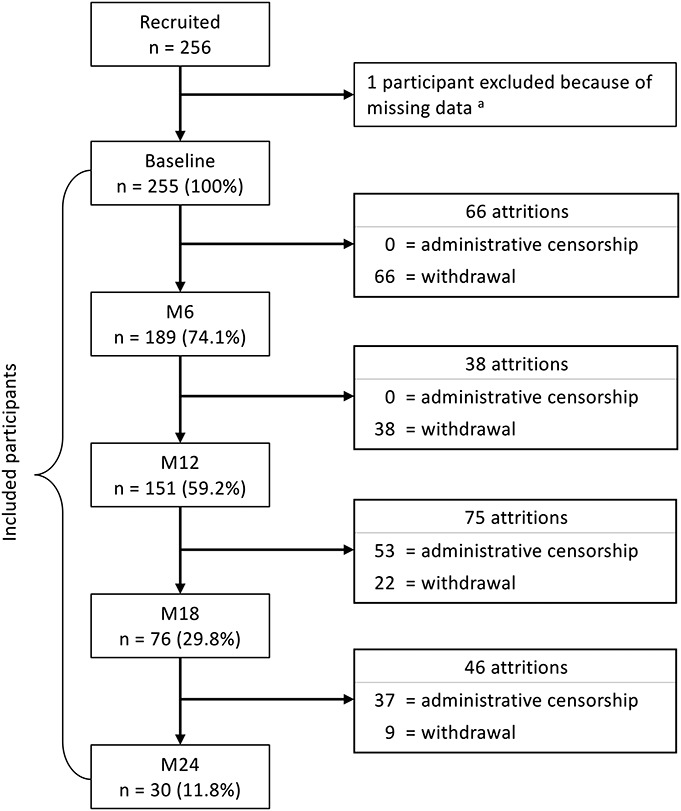
Flowchart of attrition among female sex workers participating in a PrEP demonstration study in Cotonou, Benin (2014–2016). M6, M12, M18, M24: 6-, 12- 18- 24-month follow-up visits. aOne PrEP participant was excluded from analyses, because she had missing data on variables that were used for the calculation of the inverse probability of censoring weights.