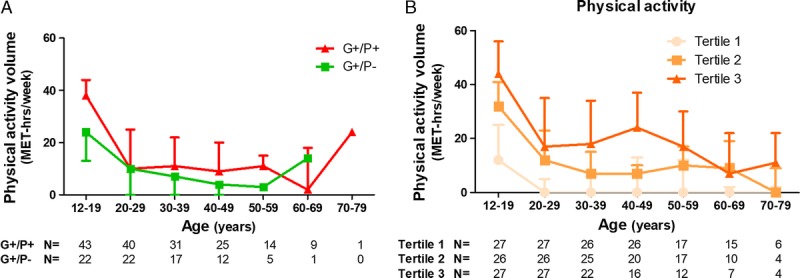
FIGURE 2.

Distribution of physical activity volumes over time of HCM gene carriers according to phenotype status (A) and of phenotypic HCM patients according to tertiles of lifelong physical activity volume (B). Individuals included per decade differ because of the heterogeneity in age of the participants, and numbers are shown below x-axis. Physical activity shown in panel A is prediagnosis physical activity for G+/P+ and lifelong physical activity for G+/P−. Physical activity shown in panel B is lifelong physical activity. Data are shown as median with interquartile range.
