
Figure 4.
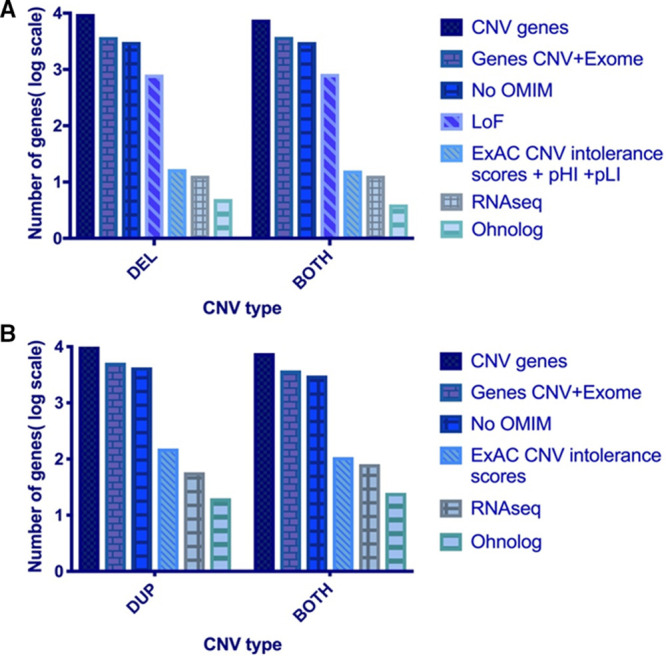
Filtering process using large-scale genomic data resources. Both graphs are in logarithmic scale and represent the consecutive filtering of the genes using the different metrics for (A) deleted (DEL) and both copy number variant (CNV) genes (B) duplicated (DUP) and both CNV genes. There is ≈70% reduction in the number of candidate genes when we apply the evolutionary duplication metric—ohnolog. Also, none of our candidates were present in the list of homozygously deleted genes (nonessential) from the Sudmant study as well as not present in the list of genes curated from the DDD study. LoF indicates loss-of-function; OMIM, Online Mendelian Inheritance in Man; pHI, probability of haploinsuffieciency; and pLI, probability of loss-of-function intolerance.