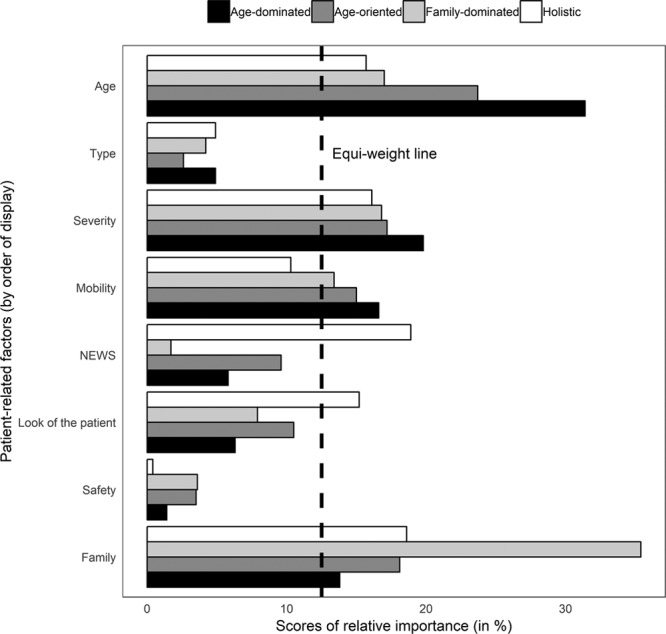
Figure 2.

Comparison of relative importance scores across the four preference patterns identified among respondents. The dashed line indicates all attributes have equal importance, that is, relative importance = 12.5% (100/8). NEWS = National Early Warning Score.
