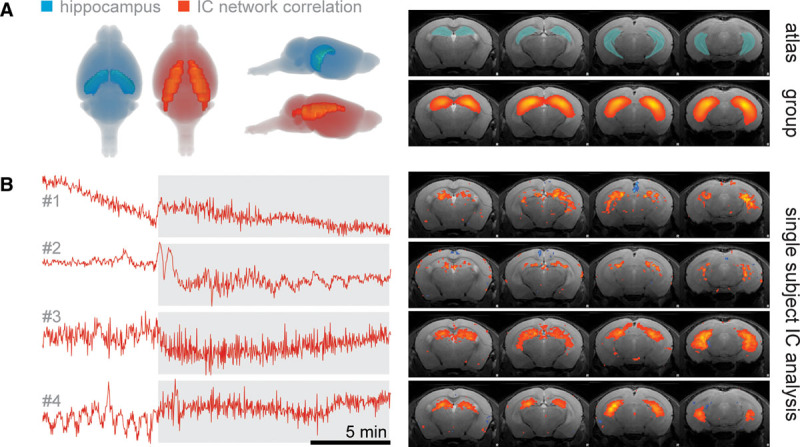
Figure 1.

Hippocampal brain network response upon elevation in tidal volume revealed by using independent component analysis (ICA) on functional MRI data. A, Network activity calculated by correlations of signal time courses in ICA group analysis of four mice shows great overlaps with the anatomical structure of the hippocampus. Gray shadings behind mouse brains (left) indicate the range of coronal brain slices (right). B, Signal time courses of independent components (ICs) extracted from the hippocampal network in four single subjects (see right for the spatial distribution of respective IC).
