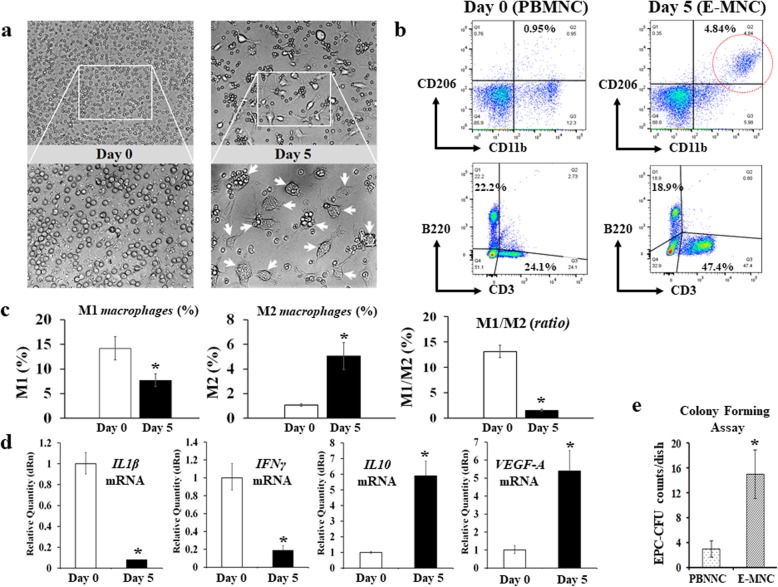
Fig. 2.
Changes in anti-inflammatory and vasculogenic potential of MNCs in 5G-culture. a Phase contrast imaging of PBMNCs (at day 0) and E-MNCs (at day 5). The white box areas in the upper images (× 100) were magnified in the lower images (× 200). b Flow cytometric analysis of M1 (CD11b+/CD206−) macrophages, M2 (CD11b+/CD206+) macrophages, T lymphocytes (CD3+), and B lymphocytes (B220+) fractions in PBMNCs (at day 0) and E-MNCs (at day 5). c Percentages of M1 (CD11b+/CD206−) and M2 (CD11b+/CD206+) macrophage fractions and the ratios (M1/M2) in PBMNCs and E-MNCs. d mRNA expressions of inflammatory genes (IL-1β and IFN-γ), an anti-inflammatory gene (IL10), and vasculogenic genes (VEGF-A) of PBMNCs (at day 0) and E-MNCs (at day 5) (*p < 0.05). e Counts of EPC-CFUs from pre-cultured PBMNCs and post-cultured PBMNCs (E-MNCs) per dish (1 × 10⁵ cells/dish)

