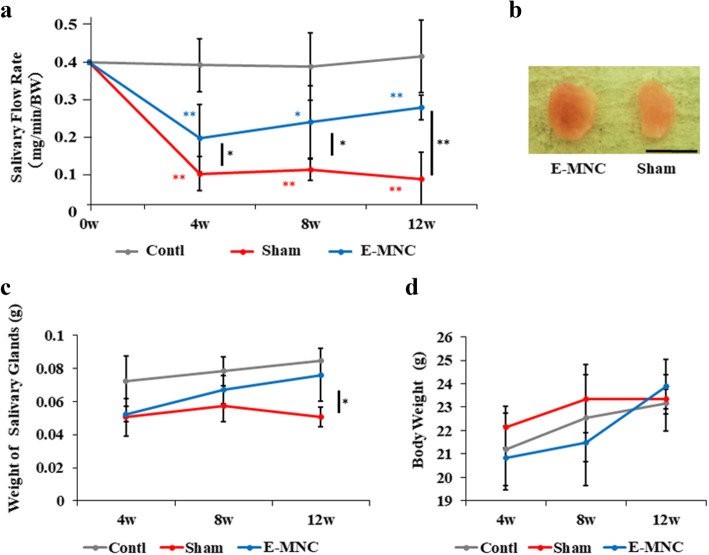
Fig. 3.
Macroscopic findings after IR and cell transplantation. a Changes of salivary flow rate (SFR) at 0, 4, 8, and 12 weeks after IR. b Gross appearance of harvested submandibular glands of the E-MNC group (EMNC-treated mice) and sham group (non-treated mice) at 12 weeks after IR (scale bar, 5 mm). c Weight changes of both submandibular glands at 4, 8, and 12 weeks after IR. d Changes of body weight at 4, 8, and 12 weeks after IR. The blue asterisk represents statistical significance between the control and E-MNC groups (**p < 0.01, *p < 0.05). The red asterisk represents statistical significance between the control and sham groups (**p < 0.01, *p < 0.05). The black asterisk represents statistical significance between the sham and E-MNC groups (**p < 0.01, *p < 0.05)

