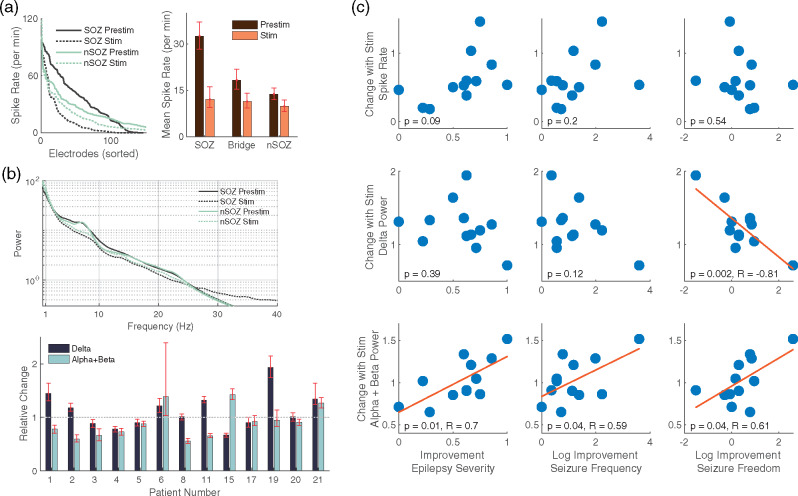
Figure 2.
Electrophysiological results with correlation to clinical results. (a) Spike rate for each electrode in the SOZ and in the non-SOZ for the pre-stimulation and stimulation conditions (left panel). Mean spike rate was decreased during stimulation (right panel) for SOZ (n = 146), Bridge (n = 160) and non-SOZ (n = 286) electrodes. (b) Mean spectral power for all electrodes in the SOZ and non-SOZ regions before and during stimulation (upper panel). At the individual patient level, changes in delta as well as alpha and beta activities were variable (lower panel, n = 97, 70, 58, 72, 104, 86, 110, 92, 114, 82, 100, 124, 78). Error bars reflect bootstrapped 95% confidence intervals. (c) Pearson’s correlation between changes in spike rate, delta power (1–4 Hz), alpha and beta power (8–20 Hz) and three clinical outcome measures: Epilepsy Severity, Seizure Frequency and Longest Period of Seizure Freedom. Displayed data are consistent with those from a normal distribution via the Anderson–Darling test (5% significance level). The 95% confidence intervals for the correlation coefficients were −0.81 [−0.43 to −0.94], 0.70 [0.22 to 0.91], 0.59 [0.03 to 0.87] and 0.61 [0.05 to 0.88]. Using the Bonferroni correction for multiple tests within each a priori outcome measure (i.e. P < 0.0167), the correlation for delta band power change with seizure freedom and alpha and beta band power change with epilepsy severity remains significant. These correlations do not reach levels of significance when the most negative and positive outlying data points are removed

